PUBLISHER: Mordor Intelligence | PRODUCT CODE: 2124438

PUBLISHER: Mordor Intelligence | PRODUCT CODE: 2124438
Middle East And Africa Battery Energy Storage System (BESS) - Market Share Analysis, Industry Trends & Statistics, Growth Forecasts (2026 - 2031)
According to Mordor Intelligence, the Middle East and Africa battery energy storage system market size in 2026 is estimated at USD 2.85 billion, growing from 2025 value of USD 2.39 billion with 2031 projections showing USD 6.86 billion, growing at 19.18% CAGR over 2026-2031.
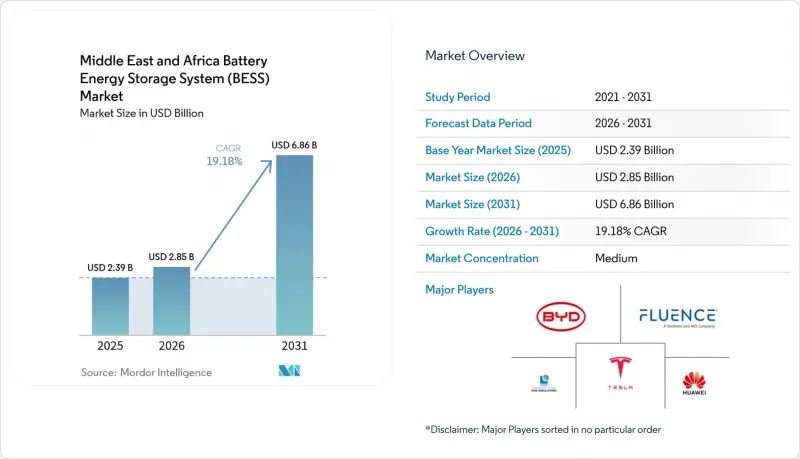
This report is Segmented by Battery Type (Lithium-Ion, Flow Batter, and More), Connection Type (On-Grid and Off-Grid), Component (Battery Pack and Racks, Energy Management Software, and More), Energy Capacity Range (10 To 100 MWh, 100 To 500 MWh, and More), End-User Application (Utility, and More), and Geography (Saudi Arabia, United Arab Emirates, Qatar, and More).
Middle East And Africa Battery Energy Storage System (BESS) Market Trends and Insights
Rapid Utility-Scale Solar and Wind Build-Outs
Saudi Arabia, the United Arab Emirates, Egypt, and South Africa are embedding four-hour storage into every new solar tender and two-hour storage into all wind solicitations, making batteries a mandatory cost of entry. Developers such as ACWA Power and Masdar have pre-ordered more than 12 GWh of lithium-iron-phosphate cells for projects scheduled before 2027. Egypt's 1 GW solar pipeline pairs 200 MWh of storage to avoid curtailment in the Suez Canal Economic Zone. South Africa's latest IPP round allocated 1.2 GW of battery capacity at tariffs that undercut Eskom's coal fleet, demonstrating competitive parity. Because grid studies now evaluate generation and storage together, average project lead times have fallen by nearly two years, accelerating revenue realization.
National Grid-Stability Mandates
Regulators in Saudi Arabia and the UAE now treat storage as essential infrastructure, issuing directives that require the grid operator to procure fixed volumes or face financial penalties. Saudi Arabia mandated 26 GWh by 2027, while the UAE agreed to a 19 GWh framework that earns capacity payments independent of energy dispatch. Multi-year contracts reduce transaction costs and provide lenders with predictable cash flows, resulting in spreads of 200-250 basis points over the SOFR rate. Qatar has launched the Gulf's first standalone 400 MWh tender, signaling a shift toward merchant storage models that monetize ancillary services. Strict IEC 62933 compliance rules filter out smaller suppliers that lack certified hardware, raising entry barriers and consolidating market share among tier-one integrators.
Lagging Distribution-Network Digitalization
Only 38% of Nigeria's distribution feeders and 12% of Tanzanian substations have supervisory control and data acquisition links, preventing batteries from delivering frequency and voltage services. Kenya Power relies on manual dispatch instructions, creating latency that forces storage operators to oversize systems by up to 30% to capture revenue. Eskom initiated a USD 1.2 billion grid modernization project in 2024, but legal disputes have slowed the rollout of four million smart meters. Without real-time data, utilities cannot fully value fast-ramping capacity, resulting in shallow ancillary-service markets. The digital gap deters investors who discount projected cash flows when dispatch certainty is low.
Other drivers and restraints analyzed in the detailed report include:
- Falling LFP Battery Prices Below USD 100/kWh
- Oil-Exporting Nations' Decarbonization Funds
- Policy Uncertainty in Several African States
For complete list of drivers and restraints, kindly check the Table Of Contents.
Segment Analysis
Lithium-ion chemistries remained dominant with an 79.82% share of the Middle East and Africa battery energy storage system market in 2025, thanks to rapid cost decline and mature supply chains. Flow batteries, however, are racing ahead at 28.25% CAGR through 2031 as utilities seek 8- to 12-hour discharge durations for daily arbitrage and seasonal shifting. Eskom's 200 MWh vanadium redox contract highlights the appeal of 20,000-cycle lifetimes, which reduce levelized storage costs.
Cost spreads are narrowing: Saudi tenders priced LFP at USD 89/kWh, only 30% below flow bids, prompting developers to reconsider chemistry diversification. Lead-acid retains a foothold in telecom backup, while sodium-ion pilots in Morocco and Egypt signal a future low-cost alternative. Thermal-runaway concerns continue to erode nickel-rich chemistries, and hybrid supercapacitors are being trialed for sub-second response in microgrids.
On-grid installations accounted for 73.65% of 2025 deployments, primarily driven by large contracts in Saudi Arabia and the UAE, which supply frequency regulation and capacity firming. Yet, off-grid systems are forecast to expand at a 26.1% CAGR, driven by African mining firms replacing diesel with solar-plus-storage hybrids that achieve a levelized cost of less than USD 0.10/kWh.
Sibanye-Stillwater's 50 MWh roll-out saves 18 million liters of diesel annually, illustrating the operational upside. Zambia's Kansanshi copper project will pair 100 MW of solar power with 40 MWh of storage to achieve full energy autonomy by 2026. Rural microgrids in Kenya and hybrid commercial and industrial (C&I) systems in South Africa enhance resilience in areas where grid outages are prevalent.
Complete Report Scope:
- By Battery Type
- Lithium-ion (Lithium Iron Phosphate (LFP), Nickel-Manganese-Cobalt (NMC), Lithium Titanate (LTO))
- Lead-acid
- Flow Battery (Vanadium Redox, Zinc-Bromine)
- Sodium-ion
- Other Battery Technologies (NiCd, Hybrid Super-capacitors)
- By Connection Type
- On-Grid (Utility Interconnected)
- Off-Grid (Micro-Grid, Hybrid)
- By Component
- Battery Pack and Racks
- Power Conversion System (PCS)
- Energy Management Software (EMS)
- Balance-of-Plant and Services
- By Energy Capacity Range
- Below 10 MWh
- 10 to 100 MWh
- 100 to 500 MWh
- Above 500 MWh
- By End-user Application
- Utility
- Commercial and Industrial
- Residential
- By Geography
- Saudi Arabia
- United Arab Emirates
- Qatar
- South Africa
- Egypt
- Kenya
- Rest of Middle East and Africa
List of Companies Covered in this Report:
- Tesla Inc.
- Huawei Digital Power
- Fluence Energy Inc.
- NGK Insulators Ltd.
- BYD Co. Ltd.
- Eaton Corporation plc
- Schneider Electric SE
- Siemens Energy AG
- Sungrow Power Supply Co.
- ABB Ltd.
- Wartsila Oyj
- Saft Groupe SA
- Aggreko Ltd.
- Eskom Holdings SOC Ltd.
- Philadelphia Solar Ltd.
- VanadiumCorp Resource Inc.
- Sumitomo Corporation
- Contemporary Amperex Technology (CATL)
- AlphaESS Co. Ltd.
- Desert Technologies (SA)
Additional Benefits:
- The market estimate (ME) sheet in Excel format
- 3 months of analyst support
TABLE OF CONTENTS
1 Introduction
- 1.1 Study Assumptions & Market Definition
- 1.2 Scope of the Study
2 Research Methodology
3 Executive Summary
4 Market Landscape
- 4.1 Market Overview
- 4.2 Market Drivers
- 4.2.1 Rapid utility-scale solar & wind build-outs
- 4.2.2 National grid-stability mandates (e.g., UAE, KSA)
- 4.2.3 Falling LFP battery prices below USD 100/kWh (2025)
- 4.2.4 Oil-exporting nations' decarbonization funds
- 4.2.5 Mining-site hybrid-power economics in Africa
- 4.2.6 Data-center power-quality requirements
- 4.3 Market Restraints
- 4.3.1 Lagging distribution-network digitalization
- 4.3.2 Policy uncertainty in several African states
- 4.3.3 Limited local battery-grade raw-material refining
- 4.3.4 High sovereign-risk financing costs
- 4.4 Supply-Chain Analysis
- 4.5 Regulatory Landscape
- 4.6 Technological Outlook
- 4.7 Porter's Five Forces
- 4.7.1 Threat of New Entrants
- 4.7.2 Bargaining Power of Suppliers
- 4.7.3 Bargaining Power of Buyers
- 4.7.4 Threat of Substitutes
- 4.7.5 Competitive Rivalry
- 4.8 Investment Analysis
5 Market Size & Growth Forecasts
- 5.1 By Battery Type
- 5.1.1 Lithium-ion (Lithium Iron Phosphate (LFP), Nickel-Manganese-Cobalt (NMC), Lithium Titanate (LTO))
- 5.1.2 Lead-acid
- 5.1.3 Flow Battery (Vanadium Redox, Zinc-Bromine)
- 5.1.4 Sodium-ion
- 5.1.5 Other Battery Technologies (NiCd, Hybrid Super-capacitors)
- 5.2 By Connection Type
- 5.2.1 On-Grid (Utility Interconnected)
- 5.2.2 Off-Grid (Micro-Grid, Hybrid)
- 5.3 By Component
- 5.3.1 Battery Pack and Racks
- 5.3.2 Power Conversion System (PCS)
- 5.3.3 Energy Management Software (EMS)
- 5.3.4 Balance-of-Plant and Services
- 5.4 By Energy Capacity Range
- 5.4.1 Below 10 MWh
- 5.4.2 10 to 100 MWh
- 5.4.3 100 to 500 MWh
- 5.4.4 Above 500 MWh
- 5.5 By End-user Application
- 5.5.1 Utility
- 5.5.2 Commercial and Industrial
- 5.5.3 Residential
- 5.6 By Geography
- 5.6.1 Saudi Arabia
- 5.6.2 United Arab Emirates
- 5.6.3 Qatar
- 5.6.4 South Africa
- 5.6.5 Egypt
- 5.6.6 Kenya
- 5.6.7 Rest of Middle East and Africa
6 Competitive Landscape
- 6.1 Market Concentration
- 6.2 Strategic Moves (M&A, Partnerships, PPAs)
- 6.3 Market Share Analysis (Market Rank/Share for key companies)
- 6.4 Company Profiles (includes Global level Overview, Market level overview, Core Segments, Financials as available, Strategic Information, Products & Services, and Recent Developments)
- 6.4.1 Tesla Inc.
- 6.4.2 Huawei Digital Power
- 6.4.3 Fluence Energy Inc.
- 6.4.4 NGK Insulators Ltd.
- 6.4.5 BYD Co. Ltd.
- 6.4.6 Eaton Corporation plc
- 6.4.7 Schneider Electric SE
- 6.4.8 Siemens Energy AG
- 6.4.9 Sungrow Power Supply Co.
- 6.4.10 ABB Ltd.
- 6.4.11 Wartsila Oyj
- 6.4.12 Saft Groupe SA
- 6.4.13 Aggreko Ltd.
- 6.4.14 Eskom Holdings SOC Ltd.
- 6.4.15 Philadelphia Solar Ltd.
- 6.4.16 VanadiumCorp Resource Inc.
- 6.4.17 Sumitomo Corporation
- 6.4.18 Contemporary Amperex Technology (CATL)
- 6.4.19 AlphaESS Co. Ltd.
- 6.4.20 Desert Technologies (SA)
7 Market Opportunities & Future Outlook
- 7.1 White-Space & Unmet-Need Assessment

