PUBLISHER: Mordor Intelligence | PRODUCT CODE: 2124960

PUBLISHER: Mordor Intelligence | PRODUCT CODE: 2124960
North America E-commerce - Market Share Analysis, Industry Trends & Statistics, Growth Forecasts (2026 - 2031)
According to Mordor Intelligence, the North America e-commerce market size was valued at USD 1.45 trillion in 2025 and estimated to grow from USD 1.59 trillion in 2026 to reach USD 2.51 trillion by 2031, at a CAGR of 9.57% during the forecast period (2026-2031).
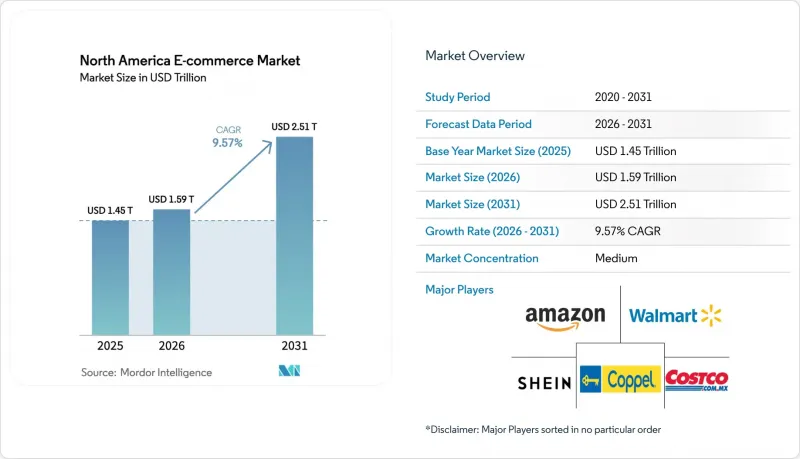
This report is Segmented by Business Model (B2C, B2B, C2C), Device Type (Smartphone / Mobile, Desktop and Laptop, Other Device Types), Payment Method (Credit / Debit Cards, Digital Wallets, BNPL, Other Payment Method), B2C Product Category (Beauty and Personal Care, Consumer Electronics, Fashion and Apparel, and More), and Country. The Market Forecasts are Provided in Terms of Value (USD).
North America E-commerce Market Trends and Insights
Mobile-commerce apps with same-day fulfillment in U.S. urban centers
Mobile transactions already generate 60% of online sales, and retailers that connect smartphone checkouts to dense micro-fulfillment hubs now deliver thousands of SKUs within hours. Same-day service neutralizes the immediacy advantage of physical stores, trims last-mile expenses by up to 30%, and locks in loyalty among convenience-driven shoppers. The North America e-commerce market is therefore seeing a rush of investment into city-center warehouses, routing algorithms, and gig-driver pools. Brands that fail to replicate these service levels risk losing urban millennials who exhibit low brand stickiness when delivery speed disappoints. Over the next two years, the resulting uplift could add 2.5 percentage points to the overall growth rate of the North America e-commerce market.
Surge of Buy Now, Pay Later adoption among Gen-Z in Canada
BNPL volume is forecast to hit USD 175 billion in North America during 2025, with Canadian Gen-Z consumers accounting for a disproportionate share. Orders financed through BNPL checkouts record 33% higher average ticket sizes and 40% lower cart abandonment than card-only flows. Canadian merchants are weaving BNPL offers into influencer campaigns and loyalty programs, turning payment choice into an acquisition lever rather than a back-office function. Heightened regulatory oversight and rising account-takeover fraud add complexity, yet sustained youth engagement keeps the medium-term impact positive for the North America e-commerce market.
Rising last-mile delivery costs from labor shortages
Transportation payrolls expanded 47% from 2013-2023, yet demand still exceeds driver availability, pushing wages 30% higher since 2020 and eroding retailer margins. Aging couriers and high turnover magnify the challenge. Retailers in the North America e-commerce market are piloting route-optimization software, parcel lockers, and autonomous vehicles, but broad deployment remains years away. Until then, companies must absorb costs or raise delivery fees, a trade-off that could dampen volume growth among price-sensitive shoppers.
Other drivers and restraints analyzed in the detailed report include:
- Expansion of cross-border e-commerce via USMCA-enabled customs simplification
- Retail-media networks boosting D2C conversion on large marketplaces
- State-level data-privacy laws elevating compliance costs
For complete list of drivers and restraints, kindly check the Table Of Contents.
Segment Analysis
The segment generated 11.84% CAGR prospects between 2026-2031, outstripping consumer growth even though B2C commands 87.72% of current revenue within the North America e-commerce market. Digitized procurement replicates consumer-grade ease, replacing fax orders with AI-guided catalogs that suggest replenishment and dynamic pricing. Enterprise buyers value real-time inventory visibility and integration with ERP systems, attributes that widen barriers to entry for late adopters. Vertical marketplaces serving healthcare, construction, and industrial supplies embed compliance certificates and financing tools, lifting switching costs.
B2B platforms are importing consumer playbooks such as one-click re-order and mobile-native interfaces, reducing friction for field technicians who now place orders from job sites. The North America e-commerce market size for B2B is also expanding as export-oriented SMEs leverage cross-border APIs that quote duties and fees immediately. Collaboration between suppliers and fintech firms accelerates embedded credit, enabling instant approval and automated net-90 payment schedules. As a result, the segment is forecast to reach USD 0.23 trillion in U.S. value alone by 2027.
Mobile wallets, voice search, and biometric log-ins collectively pushed smartphones to 71.65% transaction share in 2025, and that figure will climb through a 10.12% CAGR by 2031. Desktop retains a role for high-consideration items, yet shoppers frequently start discovery on handheld screens before closing deals elsewhere. Retailers that optimize image weight, 3D product views, and thumb-friendly navigation win higher dwell time, lifting the North America e-commerce market size attached to mobile checkouts.
Emergent channels such as smart TVs and in-car dashboards add new shopper touchpoints. Voice commerce already logs purchases from 27% of consumers. Interoperable session IDs now allow a cart to travel from phone to laptop to kiosk without re-authentication, reinforcing omnichannel continuity. As 5G coverage strengthens rural areas, latency-free rich media will reach previously underserved shoppers, cementing mobile devices as the growth core of the North America e-commerce market.
Complete Report Scope:
- By Business Model
- B2C
- B2B
- C2C
- By Device Type
- Smartphone / Mobile
- Desktop and Laptop
- Other Device Types
- By Payment Method
- Credit / Debit Cards
- Digital Wallets
- BNPL
- Other Payment Method
- By B2C Product Category
- Beauty and Personal Care
- Consumer Electronics
- Fashion and Apparel
- Food and Beverages
- Furniture and Home
- Toys, DIY and Media
- Other Product Categories
- By Country
- United States
- Canada
- Mexico
List of Companies Covered in this Report:
- Amazon.com, Inc.
- Walmart Inc.
- Apple Inc.
- Costco Wholesale Corporation
- Target Corporation
- The Home Depot, Inc.
- Best Buy Co., Inc.
- Wayfair Inc.
- The Kroger Co.
- SHEIN Group Ltd.
- eBay Inc.
- Etsy, Inc.
- Shopify Inc.
- MercadoLibre, Inc.
- Rakuten Group, Inc.
- Chewy, Inc.
- Maplebear Inc. (Instacart)
- Coppel, S.A. de C.V.
- Amway Corp.
- Overstock.com, Inc.
Additional Benefits:
- The market estimate (ME) sheet in Excel format
- 3 months of analyst support
TABLE OF CONTENTS
1 INTRODUCTION
- 1.1 Study Assumptions and Market Definition
- 1.2 Scope of the Study
2 RESEARCH METHODOLOGY
3 EXECUTIVE SUMMARY
4 MARKET LANDSCAPE
- 4.1 Market Overview
- 4.2 Market Drivers
- 4.2.1 Mobile-Commerce Apps Integration with Same-Day Fulfilment in US Urban Centres
- 4.2.2 Surge of Buy-Now-Pay-Later (BNPL) Adoption among Gen-Z in Canada
- 4.2.3 Expansion of Cross-Border E-commerce via USMCA-Enabled Customs Simplification
- 4.2.4 Retail-Media Networks Boosting D2C Conversion on Large Marketplaces
- 4.2.5 AI-Powered Personalisation Increasing Average Order Value in Fashion Segment
- 4.2.6 Dark-Store Micro-Fulfilment Accelerating Online Grocery Growth
- 4.3 Market Restraints
- 4.3.1 Rising Last-Mile Delivery Costs from Labour Shortages
- 4.3.2 State-Level Data-Privacy Laws (e.g., CPRA) Elevating Compliance Costs
- 4.3.3 High Return Rates and Reverse-Logistics Complexity in Apparel
- 4.3.4 Cyber-Fraud Targeting BNPL Checkout Flows
- 4.4 Value Chain Analysis
- 4.5 Regulatory and Technological Outlook
- 4.6 Porter's Five Forces Analysis
- 4.6.1 Bargaining Power of Suppliers
- 4.6.2 Bargaining Power of Buyers / Consumers
- 4.6.3 Threat of New Entrants
- 4.6.4 Threat of Substitute Products
- 4.6.5 Intensity of Competitive Rivalry
- 4.7 Key Market Trends and E-commerce Share of Total Retail
- 4.8 Assessment of Macro Economic Trends on the Market
- 4.9 Demographic Analysis (Population, Internet, Age, Income)
- 4.10 Cross-Border E-commerce Size and Trends
5 MARKET SIZE AND GROWTH FORECASTS (VALUES)
- 5.1 By Business Model
- 5.1.1 B2C
- 5.1.2 B2B
- 5.1.3 C2C
- 5.2 By Device Type
- 5.2.1 Smartphone / Mobile
- 5.2.2 Desktop and Laptop
- 5.2.3 Other Device Types
- 5.3 By Payment Method
- 5.3.1 Credit / Debit Cards
- 5.3.2 Digital Wallets
- 5.3.3 BNPL
- 5.3.4 Other Payment Method
- 5.4 By B2C Product Category
- 5.4.1 Beauty and Personal Care
- 5.4.2 Consumer Electronics
- 5.4.3 Fashion and Apparel
- 5.4.4 Food and Beverages
- 5.4.5 Furniture and Home
- 5.4.6 Toys, DIY and Media
- 5.4.7 Other Product Categories
- 5.5 By Country
- 5.5.1 United States
- 5.5.2 Canada
- 5.5.3 Mexico
6 COMPETITIVE LANDSCAPE
- 6.1 Market Concentration
- 6.2 Strategic Moves
- 6.3 Market Share Analysis
- 6.4 Company Profiles {(includes Global level Overview, Market level overview, Core Segments, Financials as available, Strategic Information, Market Rank/Share for key companies, Products and Services, and Recent Developments)}
- 6.4.1 Amazon.com, Inc.
- 6.4.2 Walmart Inc.
- 6.4.3 Apple Inc.
- 6.4.4 Costco Wholesale Corporation
- 6.4.5 Target Corporation
- 6.4.6 The Home Depot, Inc.
- 6.4.7 Best Buy Co., Inc.
- 6.4.8 Wayfair Inc.
- 6.4.9 The Kroger Co.
- 6.4.10 SHEIN Group Ltd.
- 6.4.11 eBay Inc.
- 6.4.12 Etsy, Inc.
- 6.4.13 Shopify Inc.
- 6.4.14 MercadoLibre, Inc.
- 6.4.15 Rakuten Group, Inc.
- 6.4.16 Chewy, Inc.
- 6.4.17 Maplebear Inc. (Instacart)
- 6.4.18 Coppel, S.A. de C.V.
- 6.4.19 Amway Corp.
- 6.4.20 Overstock.com, Inc.
7 MARKET OPPORTUNITIES AND FUTURE OUTLOOK
- 7.1 White-Space and Unmet-Need Assessment

