PUBLISHER: Mordor Intelligence | PRODUCT CODE: 2187420

PUBLISHER: Mordor Intelligence | PRODUCT CODE: 2187420
Container Shipping - Market Share Analysis, Industry Trends & Statistics, Growth Forecasts (2027 - 2032)
According to Mordor Intelligence, the container shipping market size is estimated at USD 123.1 billion in 2026 and is projected to be USD 126.7 billion in 2027, reaching USD 143.1 billion by 2032, growing at a CAGR of 2.45% from 2027 to 2032.
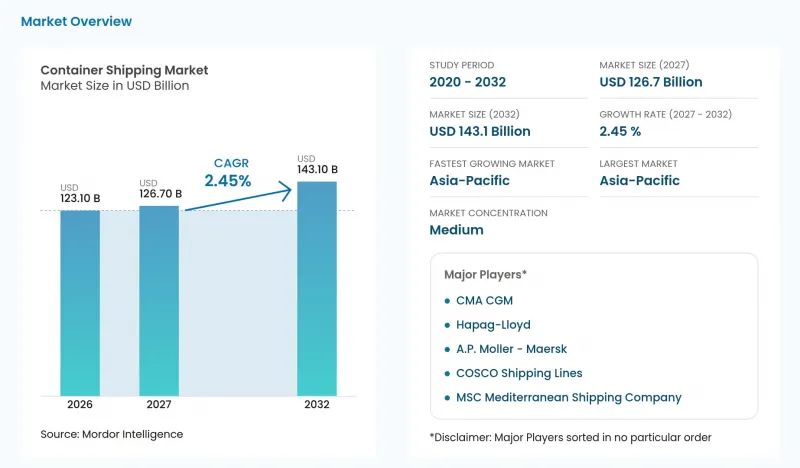
This report is segmented by Container Size (40-Foot, 20-Foot, and more), Container Type (General and Reefer), Service (Full-Container-Load and Less-Than-Container-Load), End-User Industry (FMCG and Retail, Manufacturing and Automotive, and more), and Geography (Asia-Pacific, North America, and more). The market forecasts are provided in terms of value (USD), based on availability.
Global Container Shipping Market Trends and Insights
Rising volume of international trade
World merchandise-trade volume grew 3.5% year over year in the first half of 2026. The WTO-reported container-throughput index covered 92 ports handling around 65% of global container traffic and was up 3.9% year to date through July 2026. That year-to-date gain gives carriers more physical cargo to carry alongside broader merchandise trade. The same index fell 2.5% between its February peak and July 2026, including a 4.0% drop in throughput of Chinese ports, while the North Range index covering Northern European ports was flat. The gain therefore rests on earlier months and is uneven across origin ports, so capacity placed on Chinese origin trades faces a softer recent baseline than capacity loading in Northern Europe.
Expansion of free-trade agreements
ASEAN and China signed the ASEAN-China Free Trade Area (ACFTA) 3.0 Upgrade Protocol on October 28, 2025, amending customs procedures and trade facilitation provisions. The protocol has not entered into force and requires notifications from China and at least 5 ASEAN members, followed by 60 days. That condition makes implementation, rather than signature alone, the relevant trigger for container carriers assessing additional trade opportunities. Once effective, simpler trade administration could make additional cross-border transactions commercially viable for exporters serving these connected economies. Because entry into force waits on China and at least 5 ASEAN members, the effective date will be set by the slowest required notification rather than by the signing date.
Volatile bunker fuel prices
Bunker fuel in Singapore exceeded USD 800 per metric ton by early May 2026 following the Iran war and Strait of Hormuz fuel-supply disruption that began in February 2026. OOCL's average bunker price was about USD 582 per metric ton in the first half of 2026, up 8% from USD 541 a year earlier. These movements make the fuel expense associated with committed vessel capacity harder to absorb within a fixed transport price. If carriers recover higher fuel expenses through freight charges, importers must reassess which shipments retain sufficient value after transportation. The demand most exposed is cargo whose delivered economics cannot absorb a higher sea-freight charge without reducing the quantity worth shipping.
Other drivers and restraints analyzed in the detailed report include:
- Rapid e-commerce containerization
- IMO 2023 carbon regulations drive fleet renewal
- Escalating geopolitical trade tensions
For complete list of drivers and restraints, kindly check the Table Of Contents.
Segment Analysis
40-foot (FEU) containers accounted for a 50.93% share of the container shipping market size in 2026 and are forecast to be the fastest-growing segment, with a CAGR of 3.1% from 2027 to 2032. For the OOCL Iris's February 2025 call, the Port of Savannah said it would handle more than 2,800 container moves, mostly 40-foot containers. That mix makes the format material to the loading and discharge work associated with a large vessel call. The operational value comes from coordinating vessel capacity and terminal handling around the physical boxes exchanged during the call.
Physical 40-foot equipment commitments provide a separate signal from service volumes reported in equivalent units. Matson's Hawaii container volume increased 1.6% year over year on an FEU basis in 2025, primarily due to higher general demand and a competitor vessel dry-docking in the first half of the year. In Vietnam, VIMC Lines signed a 2025 contract with Hoa Phat Sea Transport Joint Stock Company for 500 new 40-foot high-cube containers, alongside 500 20-foot dry containers. Initial delivery was planned from June 2025. The contract made 40-foot equipment part of VIMC Lines' planned capacity expansion, while Matson's gain also reflected temporary competitor unavailability.
General containers represented a 63.2% container shipping market share in 2026, making them the largest segment. CIMC's container manufacturing business sold 1.14 million TEUs of dry containers in January-June 2026, approximately 1.12% more than in the same period of 2025. Those sales establish a substantial equipment-supply base for general-cargo carriage. Their scale and modest year-over-year increase make the existing level of dry-container demand more material to CIMC's sales activity than the additional volume.
Reefer is forecast to be the fastest-growing segment, with a CAGR of 3% from 2027 to 2032. In April 2026, Euroseas signed contracts for 2 additional 2,800-TEU high-reefer containerships to be built by Huanghai Shipbuilding in China. Each vessel was specified with over 1,000 reefer plugs, with deliveries scheduled for October 2028 and January 2029. The planned plug density makes refrigerated capability an integral vessel-design commitment that could support specialized offers for temperature-sensitive cargo. Under that schedule, the new ships contribute no additional reefer slots in 2027 or most of 2028.
Complete Report Scope:
- By Container Size
- 20-Foot (TEU)
- 40-Foot (FEU)
- Others
- By Container Type
- General
- Reefer
- By Service
- Full-Container-Load (FCL)
- Less-Than-Container-Load (LCL)
- By End-User Industry
- FMCG and Retail
- Manufacturing and Automotive
- Healthcare and Pharmaceuticals
- Electronics and Electrical Equipment
- Industrial Chemicals and Raw Materials
- Others
- By Geography
- North America
- United States
- Canada
- Mexico
- South America
- Brazil
- Peru
- Chile
- Argentina
- Rest of South America
- Asia-Pacific
- India
- China
- Japan
- Australia
- South Korea
- South East Asia (Singapore, Malaysia, Thailand, Indonesia, Vietnam, and Philippines)
- Rest of Asia-Pacific
- Europe
- United Kingdom
- Germany
- France
- Spain
- Italy
- BENELUX (Belgium, Netherlands, and Luxembourg)
- NORDICS (Denmark, Finland, Iceland, Norway, and Sweden)
- Rest of Europe
- Middle East and Africa
- UAE
- Saudi Arabia
- South Africa
- Nigeria
- Rest of Middle East And Africa
- North America
Geography Analysis
Asia-Pacific held a 41.04% share of the container shipping market size in 2026 and is forecast to grow at a CAGR of 3.65% from 2027 to 2032. Singapore handled a record 44.66 million TEUs of container throughput in 2025, up 8.6% from 2024. China's ports handled 354.47 million standard containers in 2025, up 6.8% from 2024. China's foreign-trade port freight also increased in 2025, while Sri Lanka's Port of Colombo recorded its highest annual container throughput that year. Carriers can target China's expanding external trade alongside record handling at Singapore and Colombo, spreading international service opportunities across these established Asian gateways.
The United States led Northern America in Q3 2026 liner-shipping connectivity despite a year-over-year decline, supported by extensive port infrastructure and service coverage. Spain led Europe's liner-shipping connectivity in Q3 2026 through strong intra- and extra-regional connections, also despite a year-over-year decline. In 2025, Eucon connected Ireland with European destinations through container transport by sea, road, rail, and barge. Because both leaders held their positions despite year-over-year declines, their value to shippers lies in established destination coverage rather than in growing connectivity.
In South America, DP World's Callao terminal in Peru surpassed 2 million TEUs in 2025, becoming the first terminal on the region's west coast to cross that threshold. Within Middle East and Africa, Jebel Ali recorded around 9% year-over-year growth in origin and destination volumes in 2025, reflecting stronger Dubai and UAE trade flows. Egypt led African liner connectivity in Q3 2026, with ports on key Mediterranean and Red Sea routes, despite a year-over-year decline. In February 2025, ICTSI's Contecon Guayaquil in Ecuador received COSCO Shipping's inaugural WSA5 call, opening a connection to Asia via Chancay for exports including bananas and shrimp. Regional channels combine Ecuadorian banana and shrimp export access to Asia via Chancay, Dubai and UAE trade through Jebel Ali, and Egyptian ports on Mediterranean and Red Sea routes.
- MSC Mediterranean Shipping Company
- A.P. Moller - Maersk
- CMA CGM
- COSCO Shipping Lines
- Hapag-Lloyd
- ONE (Ocean Network Express)
- Evergreen Marine
- Yang Ming
- HMM Co.
- PIL (Pacific International Lines)
- ZIM Integrated Shipping
- OOCL
- Wan Hai Lines
- Matson
- X-Press Feeders
- SITC International
- Zhonggu Logistics
- Antong Holdings
- IRISL Group
Additional Benefits:
- The market estimate (ME) sheet in Excel format
- 3 months of analyst support
TABLE OF CONTENTS
1 INTRODUCTION
- 1.1 Study Assumptions and Market Definition
- 1.2 Scope of the Study
2 RESEARCH METHODOLOGY
3 EXECUTIVE SUMMARY
4 MARKET LANDSCAPE
- 4.1 Market Overview
- 4.2 Market Drivers
- 4.2.1 Rising volume of international trade
- 4.2.2 Expansion of free-trade agreements
- 4.2.3 Rapid e-commerce containerization
- 4.2.4 IMO 2023 carbon regulations drive fleet renewal
- 4.2.5 Arctic route viability (Northern Sea Route)
- 4.2.6 AI-enabled predictive routing and scheduling
- 4.3 Market Restraints
- 4.3.1 Volatile bunker fuel prices
- 4.3.2 Escalating geopolitical trade tensions
- 4.3.3 Chronic port-side congestion bottlenecks
- 4.3.4 Cyber-attacks on digital ship-to-shore systems
- 4.4 Industry Value Chain Analysis
- 4.5 Regulatory Landscape
- 4.6 Technological Outlook
- 4.7 Porter's Five Forces Analysis
- 4.7.1 Threat of New Entrants
- 4.7.2 Bargaining Power of Suppliers
- 4.7.3 Bargaining Power of Buyers
- 4.7.4 Threat of Substitutes
- 4.7.5 Competitive Rivalry
- 4.8 Pricing Analysis
5 MARKET SIZE AND GROWTH FORECASTS (VALUE)
- 5.1 By Container Size
- 5.1.1 20-Foot (TEU)
- 5.1.2 40-Foot (FEU)
- 5.1.3 Others
- 5.2 By Container Type
- 5.2.1 General
- 5.2.2 Reefer
- 5.3 By Service
- 5.3.1 Full-Container-Load (FCL)
- 5.3.2 Less-Than-Container-Load (LCL)
- 5.4 By End-User Industry
- 5.4.1 FMCG and Retail
- 5.4.2 Manufacturing and Automotive
- 5.4.3 Healthcare and Pharmaceuticals
- 5.4.4 Electronics and Electrical Equipment
- 5.4.5 Industrial Chemicals and Raw Materials
- 5.4.6 Others
- 5.5 By Geography
- 5.5.1 North America
- 5.5.1.1 United States
- 5.5.1.2 Canada
- 5.5.1.3 Mexico
- 5.5.2 South America
- 5.5.2.1 Brazil
- 5.5.2.2 Peru
- 5.5.2.3 Chile
- 5.5.2.4 Argentina
- 5.5.2.5 Rest of South America
- 5.5.3 Asia-Pacific
- 5.5.3.1 India
- 5.5.3.2 China
- 5.5.3.3 Japan
- 5.5.3.4 Australia
- 5.5.3.5 South Korea
- 5.5.3.6 South East Asia (Singapore, Malaysia, Thailand, Indonesia, Vietnam, and Philippines)
- 5.5.3.7 Rest of Asia-Pacific
- 5.5.4 Europe
- 5.5.4.1 United Kingdom
- 5.5.4.2 Germany
- 5.5.4.3 France
- 5.5.4.4 Spain
- 5.5.4.5 Italy
- 5.5.4.6 BENELUX (Belgium, Netherlands, and Luxembourg)
- 5.5.4.7 NORDICS (Denmark, Finland, Iceland, Norway, and Sweden)
- 5.5.4.8 Rest of Europe
- 5.5.5 Middle East and Africa
- 5.5.5.1 UAE
- 5.5.5.2 Saudi Arabia
- 5.5.5.3 South Africa
- 5.5.5.4 Nigeria
- 5.5.5.5 Rest of Middle East And Africa
- 5.5.1 North America
6 COMPETITIVE LANDSCAPE
- 6.1 Market Concentration
- 6.2 Strategic Moves
- 6.3 Market Share Analysis
- 6.4 Company Profiles (includes Global level Overview, Market level overview, Core Segments, Financials as available, Strategic Information, Market Rank/Share for key companies, Products and Services, and Recent Developments)
- 6.4.1 MSC Mediterranean Shipping Company
- 6.4.2 A.P. Moller - Maersk
- 6.4.3 CMA CGM
- 6.4.4 COSCO Shipping Lines
- 6.4.5 Hapag-Lloyd
- 6.4.6 ONE (Ocean Network Express)
- 6.4.7 Evergreen Marine
- 6.4.8 Yang Ming
- 6.4.9 HMM Co.
- 6.4.10 PIL (Pacific International Lines)
- 6.4.11 ZIM Integrated Shipping
- 6.4.12 OOCL
- 6.4.13 Wan Hai Lines
- 6.4.14 Matson
- 6.4.15 X-Press Feeders
- 6.4.16 SITC International
- 6.4.17 Zhonggu Logistics
- 6.4.18 Antong Holdings
- 6.4.19 IRISL Group
7 MARKET OPPORTUNITIES AND FUTURE OUTLOOK
- 7.1 White-Space and Unmet-Need Assessment

