
PUBLISHER: MTN Consulting, LLC | PRODUCT CODE: 1145451

PUBLISHER: MTN Consulting, LLC | PRODUCT CODE: 1145451
Network Operator Power Use Grew 10% in 2021: Webscalers Grew Fastest (+25%) but Telcos Still 66% of Network Operator Total, Lowering Costs and Carbon Footprint for Industry Depend on the Mobile RAN
This brief examines power consumption in the network operator industry, spanning telcos, webscalers, and carrier-neutral operators (CNNOs). This is based on a bottoms-up review of sustainability reports from 57 operators: 16 webscalers, 21 telcos and 20 CNNOs. The webscalers reviewed account for about 94% of that sector's total 2021 revenues. For telco and carrier-neutral, the surveyed companies account for a bit over 60% of revenues in the respective sectors.
Based on this large sample, we estimate that in 2021 network operators consumed approximately 467.6 Terawatt-hours (TWh) of electricity, including purchased and self-generated. Power consumption by network operators in 2021 grew by 9.8%, about the same as the 9.3% growth recorded in 2020. By operator type, webscale power consumption is booming, up 19% and 25% in 2020 and 2021, respectively, while telco power consumption grew by just 6.0% and 4.7% in the same two years. CNNOs were in the middle, recording 16% growth in power consumption in 2020, and 15% in 2021. The CNNO segment's data center specialists stand out as the biggest electricity users in the operator industry, as measured by power intensity (MWh of power per unit of revenue). In 2021, for instance, Digital Realty consumed 2,094 MWh of power per US$1M of revenue, versus 97.6 for American Tower, 82.9 for AT&T and 71.0 for Alphabet, a large tower CNNO, telco and webscaler, respectively.
Data centers rightfully get a lot of attention for their power requirements. However, despite the last few years of heavy data center investments in both the webscale and carrier-neutral market, these two segments accounted for just 22.9% and 11.1% of total network operator electricity consumption in 2021. Telcos are dominant, accounting for 66% of the three-segment total in 2021 (2020: 69.2%). Telcos' impact on the environment is even higher than this 66% would imply. For many telcos, their electricity consumption is almost entirely based on fossil fuels. KDDI's electricity consumption from renewable sources, for instance, was only 10.4% of total in 2021. Moreover, telcos consume significant amounts of non-electric energy (diesel, propane, heating oil, etc.) to power their facilities, especially mobile base stations. Africa's MTN Group, for instance, relied on diesel for 46% of its total energy consumption in 2021. For telcos to really begin reducing their carbon footprint, big improvements in both energy efficiency and fuel mix will be required in their mobile access networks.
VISUALS
Figure 2: Power intensity by
operator type (MWh consumed per US$1M in revenue)
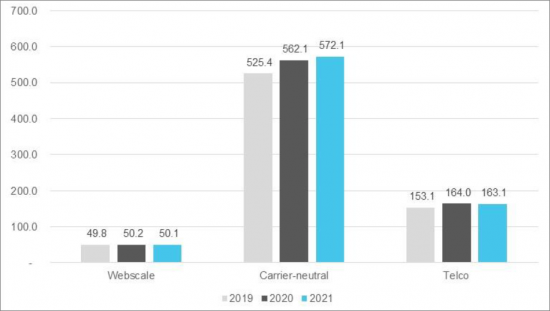
Source: MTN Consulting.
Companies and organizations mentioned in this report include:
|
|
Table of Contents
- Summary
- Energy use impacts costs and carbon footprint
- Network operator power use up 10% in 2021
- Operators' climate impact more complex than power use
- Implications
- Appendix
List of Figures
- Figure 1: Electricity consumption by operator type, 2019-21 (GWh)
- Figure 2: Power intensity by operator type (MWh consumed per US$1M in revenue)
- Figure 3: Power intensity for webscalers in sample (MWh consumed per US$1M in revenue)
- Figure 4: Power intensity for carrier-neutral operators in sample (MWh consumed per US$1M in revenue)
- Figure 5: Power intensity for telcos in sample (MWh consumed per US$1M in revenue)
- Figure 6: Telkom Indonesia's electricity consumption by facility type
- Figure 7: Components of Scope 3 emissions in 2021, Digital Realty

