
PUBLISHER: Roots Analysis | PRODUCT CODE: 2037811

PUBLISHER: Roots Analysis | PRODUCT CODE: 2037811
Biologics Contract Manufacturing Market (7th Edition) by Type of Service Offered, Type of Biologic Manufactured, Expression System Used, Scale of Operation, Company Size, Therapeutic Area, Key Geographical Regions - Trends and Forecast, Till 2035
Biologics Contract Manufacturing Market: Overview
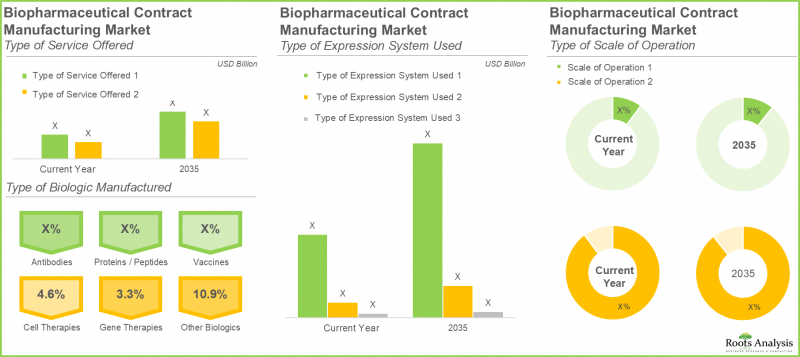
As per Roots Analysis, the global biologics contract manufacturing market is estimated to grow from USD 31.0 billion in the current year to USD 63.9 billion by 2035, at a CAGR of 8.3% during the forecast period, till 2035.
Biologics Contract Manufacturing Market: Growth and Trends
Biopharmaceuticals are therapeutic products derived from living organisms or semi-synthesized from biological sources. Owing to their complex macromolecular structures typically exceeding 1,000 Daltons, these products often fall beyond the scope of conventional chemical synthesis, prompting industry stakeholders to invest in advanced biotechnological platforms to enable scalable and efficient manufacturing.
The increasing prevalence of chronic diseases, coupled with a growing shift toward advanced therapeutic modalities, has significantly accelerated demand for biologics development. In response, a large number of developers are outsourcing manufacturing operations to specialized third-party service providers to address rising capacity requirements and enhance operational efficiency. Notably, such outsourcing strategies enable access to expanded production capabilities, technical expertise, and diversified product portfolios. Among outsourced activities, analytical testing, toxicity assessment, and fill-finish operations represent key service segments.
Additionally, demand for biopharmaceutical and pharmaceutical contract manufacturing, along with downstream process development, continues to rise. To capitalize on these opportunities, smaller service providers are actively expanding their technical capabilities and forming strategic partnerships with contract development and manufacturing organizations (CDMOs) to broaden their service offerings. As outsourcing gains wider acceptance as a strategic and cost-effective business model, the global biologics contract manufacturing market is poised for robust growth over the forecast period.
Growth Drivers: Strategic Enablers of Market Expansion
The biologics contract manufacturing market is propelled by ongoing advancements in advanced bioprocessing technologies such as single-use bioreactors, continuous perfusion systems, and AI-driven automation without incurring significant capital expenditure on in-house infrastructure. Contract manufacturing organizations (CMOs) make substantial investments in next-generation facilities, offering enhanced technical capabilities that improve production yields, minimize contamination risks, and support rapid scalability.
In addition, these service providers deliver high levels of operational flexibility, allowing companies to efficiently scale manufacturing across different volumes while addressing dynamic market demands and unforeseen challenges. Outsourcing manufacturing activities also drives significant cost efficiencies by reducing overhead and operational burdens. This, in turn, enables biopharmaceutical companies to allocate greater resources toward core competencies, particularly research and development. Overall, the model supports both innovation and cost optimization, strengthening the industry's value proposition.
Market Challenges: Critical Barriers Impeding Progress
The biologics contract manufacturing market faces several structural and operational challenges that may constrain its growth trajectory. A key concern is the high complexity of biologics production, which requires stringent process control, specialized infrastructure, and skilled expertise, thereby increasing the risk of batch failures and deviations. Additionally, regulatory compliance across multiple jurisdictions remains a significant hurdle, often leading to delays in approvals and increased operational costs.
Capacity constraints and long lead times, particularly for large-scale commercial manufacturing, further limit the ability of contract development and manufacturing organizations (CDMOs) to meet rising demand. Supply chain vulnerabilities, including dependence on critical raw materials and single-use components, also pose risks to production continuity. Moreover, issues related to technology transfer, intellectual property protection, and quality consistency can create barriers in outsourcing partnerships. Collectively, these factors add layers of complexity and cost, potentially impacting the overall efficiency and scalability of the market.
Biologics Contract Manufacturing Market: Key Insights
The report delves into the current state of the biologics contract manufacturing market and identifies potential growth opportunities within industry. Some key findings from the report include:
- The current market landscape features the presence of ~315 players that claim to offer contract manufacturing services for biopharmaceuticals across the world; of these, >35% of CMOs are headquartered in North America.
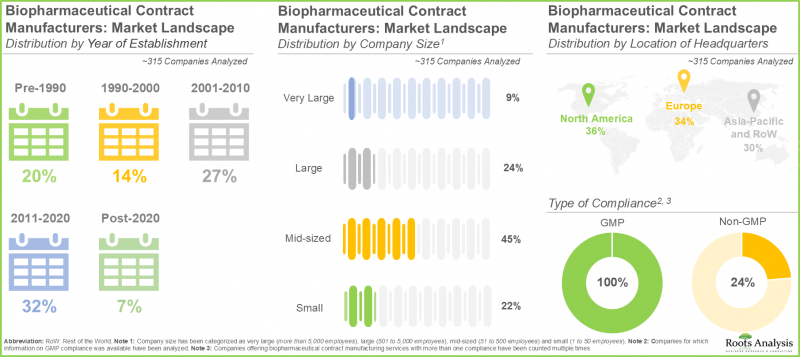
- The biopharmaceutical contract manufacturing market is highly fragmented; notably, majority (>140) of the players are mid-sized companies.
- Over 50% of the biopharmaceutical CMOs claim to possess the necessary capabilities in API, FDF, and fill-finish services; majority (~70%) of the players are engaged in the manufacturing of protein / peptides.
- North America (36%) and Europe (33%) emerged as the contract manufacturing hubs for biologics; within Asia-Pacific, China emerged as the prominent region, having the highest number of facilities (49%).
- The global installed biopharmaceutical contract manufacturing capacity is distributed across different facilities worldwide; large and very large players account for around 80% of the total capacity.
- The current biopharmaceutical contract manufacturing market size is estimated to be around USD 31.0 billion, and this value is projected to reach USD 63.9 billion by 2035, growing at a CAGR of 8.3% through 2035
- Since the past two years, the biopharmaceutical contract manufacturing market has seen a surge in strategic partnerships driven by the expanding biologics pipeline and approvals of several late-stage molecules.
- Over the recent past, CMOs in developed economies have prioritized large-scale investments to enhance antibody production capacities amid escalating demand.
Biologics Contract Manufacturing Market
The market sizing and opportunity analysis has been segmented across the following parameters:
Type of Service Offered
- Drug Substance (API) Manufacturing
- Drug Product (FDF) Manufacturing
Type of Biologic Manufactured
- Antibodies
- Proteins / Peptides
- Vaccines
- Cell Therapies
- Gene Therapies
- Other Biologics
Type of Expression System Used
- Mammalian Expression Systems
- Microbial Expression Systems
- Other Expression Systems
Scale of Operation
- Preclinical / Clinical Scale
- Commercial Scale
Therapeutic Area
- Oncological Disorders
- Cardiovascular Disorders
- Metabolic Disorders
- Infectious Diseases
- Autoimmune Disorders
- Neurological Disorders
- Genetic Disorders
- Other Disorders
Company Size
- Small Companies
- Mid-sized Companies
- Large and Very Large Companies
By Key Geographical Regions
- North America
- US
- Canada
- Puerto Rico
- Europe
- Germany
- UK
- France
- Spain
- Italy
- Rest of Europe
- Asia-Pacific
- China
- South Korea
- Japan
- Singapore
- Rest of the Asia-Pacific
- Rest of the World
- Israel
- Argentina
- Africa
Biologics Contract Manufacturing Market: Key Segments
Mammalian Expression Systems Dominate Outsourced Biologics Manufacturing
In the current year, mammalian expression systems account for over 80% of the total biologics contract manufacturing market share. This dominance is attributed to their ability to provide a human-like cellular environment for protein expression, ensuring appropriate post-translational modifications, along with high production yields, scalability, and an established safety profile across a wide range of biopharmaceutical products. Furthermore, this segment is projected to witness robust expansion, growing at a compound annual growth rate (CAGR) of 8.6% over the forecast period.
Antibodies Segment Leads Market Revenue; Cell Therapies Poised for Accelerated Growth
Based on our market forecast, antibodies represent approximately 60% of the overall biologics contract manufacturing revenue. This significant share is driven by their widespread application across multiple therapeutic areas, including oncology, autoimmune diseases, infectious disorders, and rare conditions. Looking ahead, the cell therapies segment is expected to register the fastest growth within the biologics contract manufacturing market, reflecting increasing investment and innovation in advanced therapeutic modalities.
Asia-Pacific Leads the Biologics Contract Manufacturing Market
The Asia-Pacific region holds a leading position in the biologics contract manufacturing market, accounting for approximately 40% of the overall revenue share. This dominance is primarily driven by the availability of cost-effective labor and raw materials, as well as comparatively lower capital expenditure associated with facility development and operations across the region.
China Biologics Contract Manufacturing Market
Within Asia-Pacific, China represents the largest market, underpinned by its substantial manufacturing capacity and advanced technical expertise in the development of innovative biologics, particularly monoclonal antibodies and biosimilars. Growth in the country is further supported by significant government initiatives, such as the Healthy China 2030 program, which emphasizes strengthening biopharmaceutical infrastructure. Additionally, China's cost advantages in comparison to Western markets continue to attract global outsourcing activities, reinforcing its leadership in the domain.
Example Players in the Biologics Contract Manufacturing Market
- AbbVie
- Agilent Technologies
- Boehringer Ingelheim
- Catalent
- Cipla
- Eurofins
- Fresenius Kabi
- Lonza
- Novartis
- Sandoz
- WACKER
- WuXi Biologics
Primary Research Overview
The opinions and insights presented in this study were influenced by discussions conducted with multiple stakeholders. The research report features detailed transcripts of interviews held with the following industry stakeholders:
- Chief Executive Officer, Mid-Sized Company, Scotland
- Chief Executive Officer and Co-Founder, Small Company, Slovenia
- Former Chief Technical Officer, Large Company, US
- President, Mid-Sized Company, China
- Former Senior Director of Global Strategic Marketing, Large Company, US
- Former Senior Director of Commercial Strategy and Market Insights, Large Company, US
- Former Global Head of Sales and Marketing and Head of Business Development, Large Company, US
- Business Development Manager, Small Company, Spain
- Manager Marketing and Sales, Mid-Sized Company, Germany
Biologics Contract Manufacturing Market: Research Coverage
- Market Sizing and Opportunity Analysis: The report features a thorough analysis of the global antibody contract manufacturing market, in terms of the key market segments, including [A] type of service(s) offered, [B] type of biologic manufactured, [C] type of expression system used, [D] scale of operation, [E] company size, [F] therapeutic area and [G] key geographical regions.
- Market Landscape: An in-depth assessment of the companies involved in antibody contract manufacturing market, based on several relevant parameters, such as [A] year of establishment, [B] company size, [C] location of headquarters, [D] type of service offered, [E] type of biologic manufactured, [F] scale of operation, and [G] type of expression systems used.
- Regional Capability Analysis: A comprehensive analysis of biopharmaceutical manufacturing facilities established across the key geographical regions, such as [A] North America [B] Europe [C] Asia-Pacific, and [D] rest of the world.
- Company Profiles: Detailed profiles of key service providers across North America, Europe and Asia-Pacific engaged in the biologics contract manufacturing market, focused on parameters such as [A] company overview, [B] financial information (if available), [C] service portfolio, [D] manufacturing facilities and [E] recent developments and an informed future outlook.
- Case Study - Niche Pharmaceutical Sectors: A comprehensive evaluation of the primary enablers within this industry, highlighting specific niche products such as [A] antibody-drug conjugates (ADCs), [B] bispecific antibodies, [C] cell therapies, [D] gene therapies, and [E] viral vectors.
- Case Study - In-house Manufacturing: A detailed review of various factors that need to be taken into consideration by biopharmaceutical developers while deciding whether to manufacture their respective products in-house or engage the services of a biologics CMO.
- Make Versus Buy Framework: An elaborate study of the various biopharmaceutical-focused manufacturing initiatives undertaken by top big pharma players, highlighting trends across various parameters, such as [A] number of initiatives, [B] year of initiative, [C] purpose of initiative, [D] type of initiative, [E] scale of operation and [F] type of biologic manufactured.
- Partnerships and Collaborations: An in-depth analysis of the recent collaborations within the biologics contract manufacturing market, based on several relevant parameters, such as [A] year of partnership, [B] type of partnership, [C] type of biologic manufactured, [D] therapeutic area, [E] most active players and [F] regional distribution of partnership activity that have taken place in this industry.
- Mergers and Acquisitions: A detailed analysis of the various mergers and acquisitions that have taken place within this industry, based on several relevant parameters, [A] such as year of agreement, [B] type of deal, [C] geographical location of companies, [D] type of acquisition, [E] type of biologic manufactured and [F] key value drivers.
- Recent Expansions: A detailed analysis of expansion initiatives undertaken by biologics CMO, during the period along with information on several relevant parameters, such as [A] year of expansion, [B] purpose of expansion, [C] type of biologic manufactured and [D] location of expanded facility.
- Recent Developments: An analysis of the recent developments within the biologics contract manufacturing market, highlighting information on the [A] funding investments made and [B] information on the technology advancements related to biomanufacturing.
- Capacity Analysis: An estimate of the overall installed capacity for the manufacturing of biopharmaceuticals, highlighting the distribution of the available capacity, based on [A] size of manufacturer, [B]type of expression system used and [C] geography.
- Demand Analysis: An informed estimate of the annual demand for biologics, based on various relevant parameters, such as [A] target patient population, [B] dosing frequency and [C] dose strength.
- Total Cost of Ownership: A company size-wise, detailed analysis of the total cost of ownership for biologics CMO.
- SWOT Analysis: A discussion on affiliated trends, key drivers and challenges, under an elaborate SWOT analysis, which are likely to impact the industry's evolution.
- Case Study - Virtual Pharmaceutical Companies: A case study on the virtual business model concept, along with its role in the overall biopharmaceutical industry.
Key Questions Answered in this Report
- Which are the leading companies in the biologics contract manufacturing market?
- Which region dominates the biologics contract manufacturing market?
- What are the key trends observed in the biologics contract manufacturing market?
- What factors are likely to influence the evolution of this market?
- What are the primary challenges faced by biologics contract manufacturers?
- What is the current and future market size?
- What is the CAGR of this market?
- How is the current and future market opportunity likely to be distributed across key market segments?
Reasons to Buy this Report
- The report provides a comprehensive market analysis, offering detailed revenue projections of the overall market and its specific sub-segments. This information is valuable to both established market leaders and emerging entrants.
- The report offers stakeholders a comprehensive overview of the market, including key drivers, barriers, opportunities, and challenges. This information empowers stakeholders to stay abreast of market trends and make data-driven decisions to capitalize on growth prospects.
- The report can aid businesses in identifying future opportunities in any sector. It also helps in understanding if those opportunities are worth pursuing.
- The report helps in identifying customer demand by understanding the needs, preferences, and behavior of the target audience in order to tailor products or services effectively.
- The report equips new entrants with requisite information regarding a particular market to help them build successful business strategies.
- The report allows for more effective communication with the audience and in building strong business relations.
Additional Benefits
- Complimentary PPT Insights Packs
- Complimentary Excel Data Packs for all Analytical Modules in the Report
- 15% Free Content Customization
- Detailed Report Walkthrough Session with Research Team
- Free Updated report if the report is 6-12 months old or older
TABLE OF CONTENTS
1. PREFACE
- 1.1. Introduction
- 1.2. Market Share Insights
- 1.3. Key Market Insights
- 1.4. Report Coverage
- 1.5. Key Questions Answered
- 1.6. Chapter Outlines
2. RESEARCH METHODOLOGY
- 2.1. Chapter Overview
- 2.2. Research Assumptions
- 2.2.1. Market Landscape and Market Trends
- 2.2.2. Market Forecast and Opportunity Analysis
- 2.2.3. Comparative Analysis
- 2.3. Database Building
- 2.3.1. Data Collection
- 2.3.2. Data Validation
- 2.3.3. Data Analysis
- 2.4. Project Methodology
- 2.4.1. Secondary Research
- 2.4.1.1. Annual Reports
- 2.4.1.2. Academic Research Papers
- 2.4.1.3. Company Websites
- 2.4.1.4. Investor Presentations
- 2.4.1.5. Regulatory Filings
- 2.4.1.6. White Papers
- 2.4.1.7. Industry Publications
- 2.4.1.8. Conferences and Seminars
- 2.4.1.9. Government Portals
- 2.4.1.10. Media and Press Releases
- 2.4.1.11. Newsletters
- 2.4.1.12. Industry Databases
- 2.4.1.13. Roots Proprietary Databases
- 2.4.1.14. Paid Databases and Sources
- 2.4.1.15. Social Media Portals
- 2.4.1.16. Other Secondary Sources
- 2.4.2. Primary Research
- 2.4.2.1. Types of Primary Research
- 2.4.2.1.1. Qualitative Research
- 2.4.2.1.2. Quantitative Research
- 2.4.2.1.3. Hybrid Approach
- 2.4.2.2. Advantages of Primary Research
- 2.4.2.3. Techniques for Primary Research
- 2.4.2.3.1. Interviews
- 2.4.2.3.2. Surveys
- 2.4.2.3.3. Focus Groups
- 2.4.2.3.4. Observational Research
- 2.4.2.3.5. Social Media Interactions
- 2.4.2.4. Key Opinion Leaders Considered in Primary Research
- 2.4.2.4.1. Company Executives (CXOs)
- 2.4.2.4.2. Board of Directors
- 2.4.2.4.3. Company Presidents and Vice Presidents
- 2.4.2.4.4. Research and Development Heads
- 2.4.2.4.5. Technical Experts
- 2.4.2.4.6. Subject Matter Experts
- 2.4.2.4.7. Scientists
- 2.4.2.4.8. Doctors and Other Healthcare Providers
- 2.4.2.5. Ethics and Integrity
- 2.4.2.5.1. Research Ethics
- 2.4.2.5.2. Data Integrity
- 2.4.2.1. Types of Primary Research
- 2.4.3. Analytical Tools and Databases
- 2.4.1. Secondary Research
- 2.5. Robust Quality Control
3. MARKET DYNAMICS
- 3.1. Chapter Overview
- 3.2. Forecast Methodology
- 3.2.1. Top-down Approach
- 3.2.2. Bottom-up Approach
- 3.2.3. Hybrid Approach
- 3.3. Market Assessment Framework
- 3.3.1. Total Addressable Market (TAM)
- 3.3.2. Serviceable Addressable Market (SAM)
- 3.3.3. Serviceable Obtainable Market (SOM)
- 3.3.4. Currently Acquired Market (CAM)
- 3.4. Forecasting Tools and Techniques
- 3.4.1. Qualitative Forecasting
- 3.4.2. Correlation
- 3.4.3. Regression
- 3.4.4. Extrapolation
- 3.4.5. Convergence
- 3.4.6. Sensitivity Analysis
- 3.4.7. Scenario Planning
- 3.4.8. Data Visualization
- 3.4.9. Time Series Analysis
- 3.4.10. Forecast Error Analysis
- 3.5. Key Considerations
- 3.5.1. Demographics
- 3.5.2. Government Regulations
- 3.5.3. Reimbursement Scenarios
- 3.5.4. Market Access
- 3.5.5. Supply Chain
- 3.5.6. Industry Consolidation
- 3.5.7. Pandemic / Unforeseen Disruptions Impact
- 3.6. Limitations
4. MACRO-ECONOMIC INDICATORS
- 4.1. Chapter Overview
- 4.2. Market Dynamics
- 4.2.1. Time Period
- 4.2.1.1. Historical Trends
- 4.2.1.2. Current and Forecasted Estimates
- 4.2.2. Currency Coverage
- 4.2.2.1. Major Currencies Affecting the Market
- 4.2.2.2. Factors Affecting Currency Fluctuations on the Industry
- 4.2.2.3. Impact of Currency Fluctuations on the Industry
- 4.2.3. Foreign Currency Exchange Rate
- 4.2.3.1. Impact of Foreign Exchange Rate Volatility on the Market
- 4.2.3.2. Strategies for Mitigating Foreign Exchange Risk
- 4.2.4. Recession
- 4.2.4.1. Assessment of Current Economic Conditions and Potential Impact on the Market
- 4.2.4.2. Historical Analysis of Past Recessions and Lessons Learnt
- 4.2.5. Inflation
- 4.2.5.1. Measurement and Analysis of Inflationary Pressures in the Economy
- 4.2.5.2. Potential Impact of Inflation on the Market Evolution
- 4.2.6. Interest Rates
- 4.2.6.1. Interest Rates and Their Impact on the Market
- 4.2.6.2. Strategies for Managing Interest Rate Risk
- 4.2.7. Commodity Flow Analysis
- 4.2.7.1. Type of Commodity
- 4.2.7.2. Origins and Destinations
- 4.2.7.3. Values and Weights
- 4.2.7.4. Modes of Transportation
- 4.2.8. Global Trade Dynamics
- 4.2.8.1. Import Scenario
- 4.2.8.2. Export Scenario
- 4.2.8.3. Trade Policies
- 4.2.8.4. Strategies for Mitigating the Risks Associated with Trade Barriers
- 4.2.8.5. Impact of Trade Barriers on the Market
- 4.2.9. War Impact Analysis
- 4.2.9.1. Russian-Ukraine War
- 4.2.9.2. Israel-Hamas War
- 4.2.10. COVID Impact / Related Factors
- 4.2.10.1. Global Economic Impact
- 4.2.10.2. Industry-specific Impact
- 4.2.10.3. Government Response and Stimulus Measures
- 4.2.10.4. Future Outlook and Adaptation Strategies
- 4.2.11. Other Indicators
- 4.2.11.1. Fiscal Policy
- 4.2.11.2. Consumer Spending
- 4.2.11.3. Gross Domestic Product
- 4.2.11.4. Employment
- 4.2.11.5. Taxes
- 4.2.11.6. Stock Market Performance
- 4.2.11.7. Cross Border Dynamics
- 4.2.1. Time Period
- 4.3. Conclusion
5. EXECUTIVE SUMMARY
- 5.1. Executive Summary: Market Landscape
- 5.2. Executive Summary: Market Trends
- 5.3. Executive Summary: Market Forecast and Opportunity Analysis
6. INTRODUCTION
- 6.1. Chapter Overview
- 6.2. Overview of Biopharmaceuticals
- 6.3. Expression Systems for Biopharmaceuticals
- 6.3.1. Insect Expression Systems
- 6.3.2. Mammalian Expression Systems
- 6.3.3. Microbial Expression Systems
- 6.3.3.1. Bacterial Expression Systems
- 6.3.3.2. Fungal Expression Systems
- 6.3.3.3. Yeast Expression Systems
- 6.3.4. Plant Expression Systems
- 6.3.5. Mammalian versus Microbial Expression Systems
- 6.4. Manufacturing Process of Biopharmaceuticals
- 6.4.1. Upstream Processing
- 6.4.2. Fermentation
- 6.4.3. Downstream Processing
- 6.5. Overview of Contract Manufacturing
- 6.6. Need for Outsourcing Biopharmaceutical Manufacturing Operations
- 6.6.1. Commonly Outsourced Manufacturing Operations for Biopharmaceuticals
- 6.6.2. Advantages of Outsourcing Biopharmaceutical Manufacturing Operations
- 6.6.3. Risks and Challenges Associated with Outsourcing Biopharmaceutical Manufacturing Operations
- 6.7. Key Considerations While Selecting a Contract Manufacturing Partner
- 6.8. Future Perspectives
7. MARKET LANDSCAPE
- 7.1. Chapter Overview
- 7.2. Biopharmaceutical Contract Manufacturers: Overall Market Landscape
- 7.2.1. Analysis by Year of Establishment
- 7.2.2. Analysis by Company Size
- 7.2.3. Analysis by Location of Headquarters
- 7.2.4. Analysis by Company Size and Location of Headquarters
- 7.3. Biopharmaceutical Contract Manufacturers: Analysis of Key Players
- 7.3.1. Analysis by Compliance
- 7.3.2. Analysis by Type of Service Offered
- 7.3.3. Analysis by Type of Biologic Manufactured
- 7.3.4. Analysis by Scale of Operation
- 7.3.5. Analysis by Type of Expression System Used
- 7.3.6. Analysis by Type of Primary Container Offered
8. REGIONAL CAPABILITY ANALYSIS
- 8.1. Chapter Overview
- 8.2. Key Assumptions and Parameters
- 8.3. Overview of Biopharmaceutical Contract Manufacturing Facilities
- 8.3.1. Analysis by Type of Service Offered
- 8.3.2. Analysis by Scale of Operation
- 8.4. Regional Capability Analysis: Biopharmaceutical Contract Manufacturing Facilities in North America
- 8.5. Regional Capability Analysis: Biopharmaceutical Contract Manufacturing Facilities in Europe
- 8.6. Regional Capability Analysis: Biopharmaceutical Contract Manufacturing Facilities in Asia-Pacific
- 8.7. Regional Capability Analysis: Biopharmaceutical Contract Manufacturing Facilities in Rest of the World
9. COMPANY PROFILES
- 9.1. Chapter Overview
- 9.2. Biopharmaceutical Contract Manufacturers headquartered in North America
- 9.2.1. AbbVie
- 9.2.1.1. Company Overview
- 9.2.1.2. Service Portfolio
- 9.2.2. Agilent Technologies
- 9.2.3. Catalent
- 9.2.1. AbbVie
- 9.3. Biopharmaceutical Contract Manufacturers headquartered in Europe
- 9.3.1. Boehringer Ingelheim
- 9.3.1.1. Company Overview
- 9.3.1.2. Service Portfolio
- 9.3.2. Eurofins
- 9.3.3. Fresenius Kabi
- 9.3.4. Lonza
- 9.3.5. Novartis
- 9.3.6. Sandoz
- 9.3.7. WACKER
- 9.3.1. Boehringer Ingelheim
- 9.4. Biopharmaceutical Contract Manufacturers headquartered in Asia-Pacific
- 9.4.1. Cipla
- 9.4.1.1. Company Overview
- 9.4.1.2. Service Portfolio
- 9.4.2. Wuxi Biologics
- 9.4.1. Cipla
10. PROMINENT BIOPHARMACEUTICAL SECTORS
- 10.1. Chapter Overview
- 10.2. Bispecific Antibodies
- 10.2.1. Approved and Clinical Bispecific Antibody Therapeutics: Overall Market Landscape
- 10.2.2. Bispecific Antibodies Market: Pipeline Analysis
- 10.2.2.1. Analysis by Phase of Development
- 10.2.2.2. Analysis by Target Indication
- 10.2.3. Preclinical Bispecific Antibody Therapeutics: Overall Market Landscape
- 10.2.3.1. Analysis by Stage of Development
- 10.2.3.2. Key Considerations for Manufacturing and Associated Challenges
- 10.2.4. Role of CMOs in Offering Services for Bispecific Antibodies
- 10.3. Antibody Drug Conjugates (ADCs)
- 10.3.1. Components of ADCs
- 10.3.1.1. Antibody
- 10.3.1.2. Cytotoxin
- 10.3.1.3. Linker
- 10.3.2. Antibody Drug Conjugates (ADCs): Pipeline Analysis
- 10.3.2.1. Analysis by Stage of Development
- 10.3.2.2. Analysis by Target Indication
- 10.3.2.3. Most Active Player: Analysis by Number of Therapies
- 10.3.3. Antibody Drug Conjugate Developers
- 10.3.4. Manufacturing Process
- 10.3.5. Technical Challenges Related to Antibody Drug Conjugates Manufacturing
- 10.3.6. Role of CMOs in Offering Services for ADCs
- 10.3.1. Components of ADCs
- 10.4. Cell Therapies
- 10.4.1. Cell Therapies: Overall Market Landscape
- 10.4.2. Overview of Cell Therapy Manufacturing
- 10.4.3. Cell Therapy Manufacturing Models
- 10.4.3.1. Centralized Manufacturing
- 10.4.3.2. Decentralized Manufacturing
- 10.4.4. Scalability of Cell Therapy Manufacturing Processes
- 10.4.4.1. Scale-up
- 10.4.4.2. Scale-out
- 10.4.5. Types of Cell Therapy Manufacturers
- 10.4.6. Key Challenges for Manufacturing Cell Therapies
- 10.4.7. Key Factors Influencing Cell Therapy Manufacturing
- 10.4.7.1. Cell Characterization
- 10.4.7.2. Cost of Goods
- 10.4.8. Automation of Cell Therapy Manufacturing
- 10.4.9. Cell Therapies: Pipeline Analysis
- 10.4.9.1. Analysis by Type of Cell Manufactured
- 10.4.9.2. Analysis by Type of Immune Cell Offered
- 10.5. Gene Therapies
- 10.5.1. Gene Therapies: Pipeline Analysis
- 10.5.1.1. Analysis by Stage of Development
- 10.5.1.2. Analysis by Type of Vector Used
- 10.5.1.3. Analysis by Therapeutic Area
- 10.5.2. Role of CMOs in Offering Services for Cell / Gene Therapies
- 10.5.1. Gene Therapies: Pipeline Analysis
- 10.6. Viral Vectors
- 10.6.1. Viral Vectors: Pipeline Analysis
- 10.6.1.1. Analysis by Location of Vector Manufacturing Facility
- 10.6.1.2. Analysis by Type of Viral Vector Manufactured
- 10.6.1. Viral Vectors: Pipeline Analysis
- 10.7. Plasmid DNA
- 10.7.1. Plasmid DNA: Pipeline Analysis
- 10.7.1.1. Analysis by Location of Manufacturing Facilities
- 10.7.2. Role of CMOs in Offering Services for Plasmid DNA / Viral Vectors
- 10.7.1. Plasmid DNA: Pipeline Analysis
11. CASE STUDY: OUTSOURCING OF BIOSIMILARS
- 11.1. Chapter Overview
- 11.2. Overview of Biosimilars
- 11.3. Development Stages of Biosimilars
- 11.4. Regulatory Requirements for Licensing of Biosimilars
- 11.5. Need for Outsourcing Manufacturing Operations
- 11.6. Impact of Biosimilars on the Global Contract Manufacturing Market
- 11.6.1. Biosimilars: Historical Trend of FDA Approvals
- 11.7. Biosimilars Contract Manufacturing Service Providers
- 11.8. Challenges Associated with Outsourcing of Biosimilar Manufacturing Operations
12. CASE STUDY: COMPARISON OF SMALL AND LARGE MOLECULE DRUGS / THERAPIES
- 12.1. Chapter Overview
- 12.2. Small Molecule and Large Molecule Drugs / Therapies
- 12.2.1. Comparison of General Characteristics
- 12.2.2. Comparison of Key Specifications
- 12.2.3. Comparison of Manufacturing Process
- 12.2.4. Comparison of Key Manufacturing Challenges
13. CASE STUDY: IN-HOUSE MANUFACTURING
- 13.1. Chapter Overview
- 13.2. In-House Manufacturing
- 13.2.1. Benefits Associated with In-House Manufacturing
- 13.2.2. Risks Associated with In-House Manufacturing
- 13.3. Outsourcing Trends in the Biopharmaceutical Industry
- 13.3.1. Types of Outsourcing Partners
- 13.4. Manufacturing Approaches Used for Approved Biologics
- 13.5. Choosing the Right Strategy: In-House Manufacturing versus Outsourcing
14. MAKE VERSUS BUY DECISION MAKING FRAMEWORK
- 14.1. Chapter Overview
- 14.2. Key Assumptions and Parameters
- 14.3. Biopharmaceutical Contract Manufacturers: Make versus Buy Decision Making
- 14.3.1. Scenario 1
- 14.3.2. Scenario 2
- 14.3.3. Scenario 3
- 14.3.4. Scenario 4
- 14.4. Conclusion
15. PARTNERSHIPS AND COLLABORATIONS
- 15.1. Chapter Overview
- 15.2. Partnership Models
- 15.3. Biopharmaceutical Contract Manufacturers: Partnerships and Collaborations
- 15.3.1. Cumulative Trend of Partnerships
- 15.3.2. Analysis by Type of Partnership
- 15.3.3. Analysis by Quarter and Type of Partnership
- 15.3.4. Analysis by Type of Biologic Manufactured
- 15.3.5. Analysis by Scale of Operation
- 15.3.6. Analysis by Therapeutic Area
- 15.3.7. Most Active Players: Analysis by Number of Partnerships
- 15.3.8. Analysis by Geography
- 15.3.8.1. Local and International Agreements
- 15.3.8.2. Intracontinental and Intercontinental Agreements
16. FUNDING AND INVESTMENTS ANALYSIS
- 16.1. Chapter Overview
- 16.2. Funding Models
- 16.3. Biopharmaceutical Contract Manufacturers: Funding and Investments
- 16.3.1. Cumulative Trend of Funding
- 16.3.2. Cumulative Trend of Amount Invested
- 16.3.3. Analysis of Instances by Type of Funding
- 16.3.4. Analysis by Quarter and Type of Funding
- 16.3.5. Analysis of Amount Invested by Type of Funding
- 16.3.6. Analysis of Amount Invested by Quarter and Type of Funding
- 16.3.7. Analysis by Geography
- 16.3.8. Most Active Players: Analysis by Number of Funding Instances
- 16.3.9. Most Active Players: Analysis by Amount Invested
17. MERGERS AND ACQUISITIONS
- 17.1. Chapter Overview
- 17.2. Types of Mergers and Acquisitions
- 17.3. Biopharmaceutical Contract Manufacturers: Mergers and Acquisitions
- 17.3.1. Cumulative Trend of Mergers and Acquisitions
- 17.3.2. Analysis by Type of Agreement
- 17.3.3. Analysis by Geography
- 17.3.3.1. Local and International Agreements
- 17.3.3.2. Intracontinental and Intercontinental Agreements
- 17.3.4. Most Active Players: Analysis by Number of Agreements
- 17.3.5. Ownership Change Matrix
- 17.3.6. Analysis by Key Value Drivers
18. RECENT EXPANSIONS
- 18.1. Chapter Overview
- 18.2. Type of Expansions
- 18.3. Biopharmaceutical Contract Manufacturers: Recent Expansions
- 18.3.1. Cumulative Trend of Expansions
- 18.3.2. Analysis by Type of Expansion
- 18.3.3. Analysis by Quarter and Type of Expansion
- 18.3.4. Analysis by Location of Facility (Region)
- 18.3.5. Analysis by Location of Facility (Country)
- 18.3.6. Analysis by Type of Expansion and Location of Facility (Region)
- 18.3.7. Analysis of Amount Invested by Year of Expansion
- 18.3.8. Analysis of Amount Invested by Type of Expansion
- 18.3.9. Most Active Players: Analysis by Number of Expansions
- 18.3.10. Most Active Players: Analysis by Amount Invested
19. BIG PHARMA INITIATIVES
- 19.1. Chapter Overview
- 19.2. Biopharmaceutical Contract Manufacturers: Big Pharma Players
- 19.3. Biopharmaceutical Contract Manufacturers: Initiatives Undertaken by Big Pharma Players
- 19.3.1. Cumulative Trend of Big Pharma Initiatives
- 19.3.2. Analysis by Type of Initiative
- 19.3.3. Analysis by Quarter and Type of Initiative
- 19.3.4. Analysis of Big Pharma Players by Number of Initiatives
- 19.3.5. Analysis by Type of Partnership
- 19.3.6. Analysis of Big Pharma Players by Number of Partnerships
- 19.3.7. Analysis by Type of Acquisition
- 19.3.8. Analysis of Big Pharma Players by Number of Mergers and Acquisitions
- 19.3.9. Analysis of Big Pharma Players by Number of Expansions
- 19.3.10. Big Pharma Initiatives Summary
20. CAPACITY ANALYSIS
- 20.1. Chapter Overview
- 20.2. Key Assumptions and Methodology
- 20.3. Biopharmaceutical Contract Manufacturing: Global Installed Capacity
- 20.3.1. Analysis by Company Size
- 20.3.2. Analysis by Type of Expression System Used
- 20.3.3. Analysis by Geography
- 20.3.3.1. Analysis of Biopharmaceutical Contract Manufacturing Capacity in North America
- 20.3.3.2. Analysis of Biopharmaceutical Contract Manufacturing Capacity in Europe
- 20.3.3.3. Analysis of Biopharmaceutical Contract Manufacturing Capacity in Asia-Pacific
- 20.3.3.4. Analysis of Biopharmaceutical Contract Manufacturing Capacity in Rest of the World
- 20.4. Concluding Remarks
21. DEMAND ANALYSIS
- 21.1. Chapter Overview
- 21.2. Key Assumptions and Methodology
- 21.3. Global Demand for Biopharmaceutical Contract Manufacturing
- 21.4. Global Demand for Biopharmaceutical Contract Manufacturing: Analysis by Scale of Operation
- 21.5. Global Demand for Emerging Novel Biologics
- 21.5.1. Global Demand for ADC Therapeutics
- 21.5.2. Global Demand for Cell Therapy Manufacturing
22. TOTAL COST OF OWNERSHIP
- 22.1. Chapter Overview
- 22.2. Key Parameters
- 22.3. Assumptions and Methodology
- 22.4. Total Cost of Ownership (Sample Dataset)
- 22.5. Total Cost of Ownership for Mid-sized Biopharmaceutical Contract Manufacturing Organizations, Y0-Y20
- 22.5.1. Total Cost of Ownership for Mid-sized Biopharmaceutical Contract Manufacturing Organizations: Analysis by CAPEX, Y0
- 22.5.2. Total Cost of Ownership for Mid-sized Biopharmaceutical Contract Manufacturing Organizations: Analysis by OPEX, Y1-Y20
- 22.6. Total Cost of Ownership for Large / Very Large Biopharmaceutical Contract Manufacturing Organizations, Y0-Y20
- 22.6.1. Total Cost of Ownership for Large / Very Large Biopharmaceutical Contract Manufacturing Organizations: Analysis by CAPEX, Y0
- 22.6.2. Total Cost of Ownership for Large / Very Large Biopharmaceutical Contract Manufacturing Organizations: Analysis by OPEX, Y1-Y20
23. SWOT ANALYSIS
- 23.1. Chapter Overview
- 23.2. Strengths
- 23.3. Weaknesses
- 23.4. Opportunities
- 23.5. Threats
- 23.6. Comparison of SWOT Factors
- 23.7. Conclusion
24. GLOBAL BIOLOGICS CONTRACT MANUFACTURING MARKET
- 24.1. Chapter Overview
- 24.2. Assumptions and Methodology
- 24.3. Global Biologics Contract Manufacturing Market, Historical Trends (since 2022) and Forecasted Estimates (till 2035)
- 24.3.1. Roots Analysis Perspective on Market Growth
- 24.3.2. Scenario Analysis
- 24.3.2.1. Conservative Scenario
- 24.3.2.2. Optimistic Scenario
- 24.4. Key Market Segmentations
25. BIOLOGICS CONTRACT MANUFACTURING MARKET, BY TYPE OF SERVICE OFFERED
- 25.1. Chapter Overview
- 25.2. Key Assumptions and Methodology
- 25.3. Biologics Contract Manufacturing Market: Distribution by Type of Service Offered
- 25.3.1. Drug Substance (API) Manufacturing: Historical Trends (since 2022) and Forecasted Estimates (till 2035)
- 25.3.2. Drug Product (FDF) Manufacturing: Historical Trends (since 2022) and Forecasted Estimates (till 2035)
- 25.4. Data Triangulation and Validation
26. BIOLOGICS CONTRACT MANUFACTURING MARKET, BY TYPE OF BIOLOGIC MANUFACTURED
- 26.1. Chapter Overview
- 26.2. Key Assumptions and Methodology
- 26.3. Biologics Contract Manufacturing Market: Distribution by Type of Biologic Manufactured
- 26.3.1. Antibodies: Historical Trends (since 2022) and Forecasted Estimates (till 2035)
- 26.3.2. Proteins / Peptides: Historical Trends (since 2022) and Forecasted Estimates (till 2035)
- 26.3.3. Vaccines: Historical Trends (since 2022) and Forecasted Estimates (till 2035)
- 26.3.4. Cell Therapies: Historical Trends (since 2022) and Forecasted Estimates (till 2035)
- 26.3.5. Gene Therapies: Historical Trends (since 2022) and Forecasted Estimates (till 2035)
- 26.3.6. Other Biologics: Historical Trends (since 2022) and Forecasted Estimates (till 2035)
- 26.4. Data Triangulation and Validation
27. BIOLOGICS CONTRACT MANUFACTURING MARKET, BY TYPE OF EXPRESSION SYSTEM USED
- 27.1. Chapter Overview
- 27.2. Key Assumptions and Methodology
- 27.3. Biologics Contract Manufacturing Market: Distribution by Type of Expression System Used
- 27.3.1. Mammalian Expression Systems: Historical Trends (since 2022) and Forecasted Estimates (till 2035)
- 27.3.2. Microbial Expression Systems: Historical Trends (since 2022) and Forecasted Estimates (till 2035)
- 27.3.3. Other Expression Systems: Historical Trends (since 2022) and Forecasted Estimates (till 2035)
- 27.4. Data Triangulation and Validation
28. BIOLOGICS CONTRACT MANUFACTURING MARKET, BY SCALE OF OPERATION
- 28.1. Chapter Overview
- 28.2. Key Assumptions and Methodology
- 28.3. Biologics Contract Manufacturing Market: Distribution by Scale of Operation
- 28.3.1. Preclinical / Clinical Scale: Historical Trends (since 2022) and Forecasted Estimates (till 2035)
- 28.3.2. Commercial Scale: Historical Trends (since 2022) and Forecasted Estimates (till 2035)
- 28.4. Data Triangulation and Validation
29. BIOLOGICS CONTRACT MANUFACTURING MARKET, BY COMPANY SIZE
- 29.1. Chapter Overview
- 29.2. Key Assumptions and Methodology
- 29.3. Biologics Contract Manufacturing Market: Distribution by Company Size
- 29.3.1. Small Companies: Historical Trends (since 2022) and Forecasted Estimates (till 2035)
- 29.3.2. Mid-sized Companies: Historical Trends (since 2022) and Forecasted Estimates (till 2035)
- 29.3.3. Large and Very Large Companies: Historical Trends (since 2022) and Forecasted Estimates (till 2035)
- 29.4. Data Triangulation and Validation
30. BIOLOGICS CONTRACT MANUFACTURING MARKET, BY THERAPEUTIC AREA
- 30.1. Chapter Overview
- 30.2. Key Assumptions and Methodology
- 30.3. Biologics Contract Manufacturing Market: Distribution by Therapeutic Area
- 30.3.1. Oncological Disorders: Historical Trends (since 2022) and Forecasted Estimates (till 2035)
- 30.3.2. Cardiovascular Disorders: Historical Trends (since 2022) and Forecasted Estimates (till 2035)
- 30.3.3. Metabolic Disorders: Historical Trends (since 2022) and Forecasted Estimates (till 2035)
- 30.3.4. Infectious Diseases: Historical Trends (since 2022) and Forecasted Estimates (till 2035)
- 30.3.5. Autoimmune Disorders: Historical Trends (since 2022) and Forecasted Estimates (till 2035)
- 30.3.6. Neurological Disorders: Historical Trends (since 2022) and Forecasted Estimates (till 2035)
- 30.3.7. Genetic Disorders: Historical Trends (since 2022) and Forecasted Estimates (till 2035)
- 30.3.8. Other Disorders: Historical Trends (since 2022) and Forecasted Estimates (till 2035)
- 30.4. Data Triangulation and Validation
31. BIOLOGICS CONTRACT MANUFACTURING MARKET, BY KEY GEOGRAPHICAL REGIONS
- 31.1. Chapter Overview
- 31.2. Key Assumptions and Methodology
- 31.3. Biologics Contract Manufacturing Market: Distribution by Key Geographical Regions
- 31.3.1. North America: Historical Trends (since 2022) and Forecasted Estimates (till 2035)
- 31.3.1.1. US: Historical Trends (since 2022) and Forecasted Estimates (till 2035)
- 31.3.1.2. Canada: Historical Trends (since 2022) and Forecasted Estimates (till 2035)
- 31.3.1.3. Puerto Rico: Historical Trends (since 2022) and Forecasted Estimates (till 2035)
- 31.3.2. Europe: Historical Trends (since 2022) and Forecasted Estimates (till 2035)
- 31.3.2.1. Germany: Historical Trends (since 2022) and Forecasted Estimates (till 2035)
- 31.3.2.2. UK: Historical Trends (since 2022) and Forecasted Estimates (till 2035)
- 31.3.2.3. France: Historical Trends (since 2022) and Forecasted Estimates (till 2035)
- 31.3.2.4. Spain: Historical Trends (since 2022) and Forecasted Estimates (till 2035)
- 31.3.2.5. Italy: Historical Trends (since 2022) and Forecasted Estimates (till 2035)
- 31.3.2.6. Rest of Europe: Historical Trends (since 2022) and Forecasted Estimates (till 2035)
- 31.3.3. Asia-Pacific: Historical Trends (since 2022) and Forecasted Estimates (till 2035)
- 31.3.3.1. China: Historical Trends (since 2022) and Forecasted Estimates (till 2035)
- 31.3.3.2. South Korea: Historical Trends (since 2022) and Forecasted Estimates (till 2035)
- 31.3.3.3. Japan: Historical Trends (since 2022) and Forecasted Estimates (till 2035)
- 31.3.3.4. Singapore: Historical Trends (since 2022) and Forecasted Estimates (till 2035)
- 31.3.3.5. Rest of Asia-Pacific: Historical Trends (since 2022) and Forecasted Estimates (till 2035)
- 31.3.4. Rest of the World: Historical Trends (since 2022) and Forecasted Estimates (till 2035)
- 31.3.4.1. Israel: Historical Trends (since 2022) and Forecasted Estimates (till 2035)
- 31.3.4.2. Argentina: Historical Trends (since 2022) and Forecasted Estimates (till 2035)
- 31.3.4.3. Africa: Historical Trends (since 2022) and Forecasted Estimates (till 2035)
- 31.3.1. North America: Historical Trends (since 2022) and Forecasted Estimates (till 2035)
- 31.4. Market Dynamics Assessment
- 31.4.1. Market Movement Analysis
- 31.4.2. Penetration Growth (P-G) Matrix
- 31.5. Data Triangulation and Validation
32. BIOLOGICS CONTRACT MANUFACTURING MARKET: NORTH AMERICA
- 32.1. Biologics Contract Manufacturing Market in North America: Distribution by Type of Service Offered
- 32.1.1. Biologics Contract Manufacturing Market in North America for Drug Substance (API) Manufacturing: Historical Trends (since 2022) and Forecasted Estimates (till 2035)
- 32.1.2. Biologics Contract Manufacturing Market in North America for Drug Product (FDF) Manufacturing: Historical Trends (since 2022) and Forecasted Estimates (till 2035)
- 32.2. Biologics Contract Manufacturing Market in North America: Distribution by Type of Biologic Manufactured
- 32.2.1. Biologics Contract Manufacturing Market in North America for Antibodies: Historical Trends (since 2022) and Forecasted Estimates (till 2035)
- 32.2.2. Biologics Contract Manufacturing Market in North America for Proteins / Peptides: Historical Trends (since 2022) and Forecasted Estimates (till 2035)
- 32.2.3. Biologics Contract Manufacturing Market in North America for Vaccines: Historical Trends (since 2022) and Forecasted Estimates (till 2035)
- 32.2.4. Biologics Contract Manufacturing Market in North America for Cell Therapies: Historical Trends (since 2022) and Forecasted Estimates (till 2035)
- 32.2.5. Biologics Contract Manufacturing Market in North America for Gene Therapies: Historical Trends (since 2022) and Forecasted Estimates (till 2035)
- 32.2.6. Biologics Contract Manufacturing Market in North America for Other Biologics: Historical Trends (since 2022) and Forecasted Estimates (till 2035)
- 32.3. Biologics Contract Manufacturing Market in North America: Distribution by Type of Expression System Used
- 32.3.1. Biologics Contract Manufacturing Market in North America for Mammalian Expression Systems: Historical Trends (since 2022) and Forecasted Estimates (till 2035)
- 32.3.2. Biologics Contract Manufacturing Market in North America for Microbial Expression Systems: Historical Trends (since 2022) and Forecasted Estimates (till 2035)
- 32.3.3. Biologics Contract Manufacturing Market in North America for Other Expression Systems: Historical Trends (since 2022) and Forecasted Estimates (till 2035)
- 32.4. Biologics Contract Manufacturing Market: Distribution by Scale of Operation
- 32.4.1. Biologics Contract Manufacturing Market in North America for Preclinical / Clinical Scale: Historical Trends (since 2022) and Forecasted Estimates (till 2035)
- 32.4.2. Biologics Contract Manufacturing Market in North America for Commercial Scale: Historical Trends (since 2022) and Forecasted Estimates (till 2035)
- 32.5. Biologics Contract Manufacturing Market: Distribution by Company Size
- 32.5.1. Biologics Contract Manufacturing Market in North America for Small Companies: Historical Trends (since 2022) and Forecasted Estimates (till 2035)
- 32.5.2. Biologics Contract Manufacturing Market in North America for Mid-sized Companies: Historical Trends (since 2022) and Forecasted Estimates (till 2035)
- 32.5.3. Biologics Contract Manufacturing Market in North America for Large and Very Large Companies: Historical Trends (since 2022) and Forecasted Estimates (till 2035)
- 32.6. Biologics Contract Manufacturing Market: Distribution by Therapeutic Area
- 32.6.1. Biologics Contract Manufacturing Market in North America for Oncological Disorders: Historical Trends (since 2022) and Forecasted Estimates (till 2035)
- 32.6.2. Biologics Contract Manufacturing Market in North America for Cardiovascular Disorders: Historical Trends (since 2022) and Forecasted Estimates (till 2035)
- 32.6.3. Biologics Contract Manufacturing Market in North America for Metabolic Disorders: Historical Trends (since 2022) and Forecasted Estimates (till 2035)
- 32.6.4. Biologics Contract Manufacturing Market in North America for Infectious Diseases: Historical Trends (since 2022) and Forecasted Estimates (till 2035)
- 32.6.5. Biologics Contract Manufacturing Market in North America for Autoimmune Disorders: Historical Trends (since 2022) and Forecasted Estimates (till 2035)
- 32.6.6. Biologics Contract Manufacturing Market in North America for Neurological Disorders: Historical Trends (since 2022) and Forecasted Estimates (till 2035)
- 32.6.7. Biologics Contract Manufacturing Market in North America for Genetic Disorders: Historical Trends (since 2022) and Forecasted Estimates (till 2035)
- 32.6.8. Biologics Contract Manufacturing Market in North America for Other Disorders: Historical Trends (since 2022) and Forecasted Estimates (till 2035)
33. BIOLOGICS CONTRACT MANUFACTURING MARKET: EUROPE
- 33.1. Biologics Contract Manufacturing Market in Europe: Distribution by Type of Service Offered
- 33.1.1. Biologics Contract Manufacturing Market in Europe for Drug Substance (API) Manufacturing: Historical Trends (since 2022) and Forecasted Estimates (till 2035)
- 33.1.2. Biologics Contract Manufacturing Market in Europe for Drug Product (FDF) Manufacturing: Historical Trends (since 2022) and Forecasted Estimates (till 2035)
- 33.2. Biologics Contract Manufacturing Market in Europe: Distribution by Type of Biologic Manufactured
- 33.2.1. Biologics Contract Manufacturing Market in Europe for Antibodies: Historical Trends (since 2022) and Forecasted Estimates (till 2035)
- 33.2.2. Biologics Contract Manufacturing Market in Europe for Proteins / Peptides: Historical Trends (since 2022) and Forecasted Estimates (till 2035)
- 33.2.3. Biologics Contract Manufacturing Market in Europe for Vaccines: Historical Trends (since 2022) and Forecasted Estimates (till 2035)
- 33.2.4. Biologics Contract Manufacturing Market in Europe for Cell Therapies: Historical Trends (since 2022) and Forecasted Estimates (till 2035)
- 33.2.5. Biologics Contract Manufacturing Market in Europe for Gene Therapies: Historical Trends (since 2022) and Forecasted Estimates (till 2035)
- 33.2.6. Biologics Contract Manufacturing Market in Europe for Other Biologics: Historical Trends (since 2022) and Forecasted Estimates (till 2035)
- 33.3. Biologics Contract Manufacturing Market in Europe: Distribution by Type of Expression System Used
- 33.3.1. Biologics Contract Manufacturing Market in Europe for Mammalian Expression Systems: Historical Trends (since 2022) and Forecasted Estimates (till 2035)
- 33.3.2. Biologics Contract Manufacturing Market in Europe for Microbial Expression Systems: Historical Trends (since 2022) and Forecasted Estimates (till 2035)
- 33.3.3. Biologics Contract Manufacturing Market in Europe for Other Expression Systems: Historical Trends (since 2022) and Forecasted Estimates (till 2035)
- 33.4. Biologics Contract Manufacturing Market: Distribution by Scale of Operation
- 33.4.1. Biologics Contract Manufacturing Market in Europe for Preclinical / Clinical Scale: Historical Trends (since 2022) and Forecasted Estimates (till 2035)
- 33.4.2. Biologics Contract Manufacturing Market in Europe for Commercial Scale: Historical Trends (since 2022) and Forecasted Estimates (till 2035)
- 33.5. Biologics Contract Manufacturing Market: Distribution by Company Size
- 33.5.1. Biologics Contract Manufacturing Market in Europe for Small Companies: Historical Trends (since 2022) and Forecasted Estimates (till 2035)
- 33.5.2. Biologics Contract Manufacturing Market in Europe for Mid-sized Companies: Historical Trends (since 2022) and Forecasted Estimates (till 2035)
- 33.5.3. Biologics Contract Manufacturing Market in Europe for Large and Very Large Companies: Historical Trends (since 2022) and Forecasted Estimates (till 2035)
- 33.6. Biologics Contract Manufacturing Market: Distribution by Therapeutic Area
- 33.6.1. Biologics Contract Manufacturing Market in Europe for Oncological Disorders: Historical Trends (since 2022) and Forecasted Estimates (till 2035)
- 33.6.2. Biologics Contract Manufacturing Market in Europe for Cardiovascular Disorders: Historical Trends (since 2022) and Forecasted Estimates (till 2035)
- 33.6.3. Biologics Contract Manufacturing Market in Europe for Metabolic Disorders: Historical Trends (since 2022) and Forecasted Estimates (till 2035)
- 33.6.4. Biologics Contract Manufacturing Market in Europe for Infectious Diseases: Historical Trends (since 2022) and Forecasted Estimates (till 2035)
- 33.6.5. Biologics Contract Manufacturing Market in Europe for Autoimmune Disorders: Historical Trends (since 2022) and Forecasted Estimates (till 2035)
- 33.6.6. Biologics Contract Manufacturing Market in Europe for Neurological Disorders: Historical Trends (since 2022) and Forecasted Estimates (till 2035)
- 33.6.7. Biologics Contract Manufacturing Market in Europe for Genetic Disorders: Historical Trends (since 2022) and Forecasted Estimates (till 2035)
- 33.6.8. Biologics Contract Manufacturing Market in Europe for Other Disorders: Historical Trends (since 2022) and Forecasted Estimates (till 2035)
34. BIOLOGICS CONTRACT MANUFACTURING MARKET: ASIA-PACIFIC
- 34.1. Biologics Contract Manufacturing Market in Asia-Pacific: Distribution by Type of Service Offered
- 34.1.1. Biologics Contract Manufacturing Market in Asia-Pacific for Drug Substance (API) Manufacturing: Historical Trends (since 2022) and Forecasted Estimates (till 2035)
- 34.1.2. Biologics Contract Manufacturing Market in Asia-Pacific for Drug Product (FDF) Manufacturing: Historical Trends (since 2022) and Forecasted Estimates (till 2035)
- 34.2. Biologics Contract Manufacturing Market in Asia-Pacific: Distribution by Type of Biologic Manufactured
- 34.2.1. Biologics Contract Manufacturing Market in Asia-Pacific for Antibodies: Historical Trends (since 2022) and Forecasted Estimates (till 2035)
- 34.2.2. Biologics Contract Manufacturing Market in Asia-Pacific for Proteins / Peptides: Historical Trends (since 2022) and Forecasted Estimates (till 2035)
- 34.2.3. Biologics Contract Manufacturing Market in Asia-Pacific for Vaccines: Historical Trends (since 2022) and Forecasted Estimates (till 2035)
- 34.2.4. Biologics Contract Manufacturing Market in Asia-Pacific for Cell Therapies: Historical Trends (since 2022) and Forecasted Estimates (till 2035)
- 34.2.5. Biologics Contract Manufacturing Market in Asia-Pacific for Gene Therapies: Historical Trends (since 2022) and Forecasted Estimates (till 2035)
- 34.2.6. Biologics Contract Manufacturing Market in Asia-Pacific for Other Biologics: Historical Trends (since 2022) and Forecasted Estimates (till 2035)
- 34.3. Biologics Contract Manufacturing Market in Asia-Pacific: Distribution by Type of Expression System Used
- 34.3.1. Biologics Contract Manufacturing Market in Asia-Pacific for Mammalian Expression Systems: Historical Trends (since 2022) and Forecasted Estimates (till 2035)
- 34.3.2. Biologics Contract Manufacturing Market in Asia-Pacific for Microbial Expression Systems: Historical Trends (since 2022) and Forecasted Estimates (till 2035)
- 34.3.3. Biologics Contract Manufacturing Market in Asia-Pacific for Other Expression Systems: Historical Trends (since 2022) and Forecasted Estimates (till 2035)
- 34.4. Biologics Contract Manufacturing Market: Distribution by Scale of Operation
- 34.4.1. Biologics Contract Manufacturing Market in Asia-Pacific for Preclinical / Clinical Scale: Historical Trends (since 2022) and Forecasted Estimates (till 2035)
- 34.4.2. Biologics Contract Manufacturing Market in Asia-Pacific for Commercial Scale: Historical Trends (since 2022) and Forecasted Estimates (till 2035)
- 34.5. Biologics Contract Manufacturing Market: Distribution by Company Size
- 34.5.1. Biologics Contract Manufacturing Market in Asia-Pacific for Small Companies: Historical Trends (since 2022) and Forecasted Estimates (till 2035)
- 34.5.2. Biologics Contract Manufacturing Market in Asia-Pacific for Mid-sized Companies: Historical Trends (since 2022) and Forecasted Estimates (till 2035)
- 34.5.3. Biologics Contract Manufacturing Market in Asia-Pacific for Large and Very Large Companies: Historical Trends (since 2022) and Forecasted Estimates (till 2035)
- 34.6. Biologics Contract Manufacturing Market: Distribution by Therapeutic Area
- 34.6.1. Biologics Contract Manufacturing Market in Asia-Pacific for Oncological Disorders: Historical Trends (since 2022) and Forecasted Estimates (till 2035)
- 34.6.2. Biologics Contract Manufacturing Market in Asia-Pacific for Cardiovascular Disorders: Historical Trends (since 2022) and Forecasted Estimates (till 2035)
- 34.6.3. Biologics Contract Manufacturing Market in Asia-Pacific for Metabolic Disorders: Historical Trends (since 2022) and Forecasted Estimates (till 2035)
- 34.6.4. Biologics Contract Manufacturing Market in Asia-Pacific for Infectious Diseases: Historical Trends (since 2022) and Forecasted Estimates (till 2035)
- 34.6.5. Biologics Contract Manufacturing Market in Asia-Pacific for Autoimmune Disorders: Historical Trends (since 2022) and Forecasted Estimates (till 2035)
- 34.6.6. Biologics Contract Manufacturing Market in Asia-Pacific for Neurological Disorders: Historical Trends (since 2022) and Forecasted Estimates (till 2035)
- 34.6.7. Biologics Contract Manufacturing Market in Asia-Pacific for Genetic Disorders: Historical Trends (since 2022) and Forecasted Estimates (till 2035)
- 34.6.8. Biologics Contract Manufacturing Market in Asia-Pacific for Other Disorders: Historical Trends (since 2022) and Forecasted Estimates (till 2035)
35. BIOLOGICS CONTRACT MANUFACTURING MARKET: REST OF THE WORLD
- 35.1. Biologics Contract Manufacturing Market in Rest of the world: Distribution by Type of Service Offered
- 35.1.1. Biologics Contract Manufacturing Market in Rest of the world for Drug Substance (API) Manufacturing: Historical Trends (since 2022) and Forecasted Estimates (till 2035)
- 35.1.2. Biologics Contract Manufacturing Market in Rest of the world for Drug Product (FDF) Manufacturing: Historical Trends (since 2022) and Forecasted Estimates (till 2035)
- 35.2. Biologics Contract Manufacturing Market in Rest of the world: Distribution by Type of Biologic Manufactured
- 35.2.1. Biologics Contract Manufacturing Market in Rest of the world for Antibodies: Historical Trends (since 2022) and Forecasted Estimates (till 2035)
- 35.2.2. Biologics Contract Manufacturing Market in Rest of the world for Proteins / Peptides: Historical Trends (since 2022) and Forecasted Estimates (till 2035)
- 35.2.3. Biologics Contract Manufacturing Market in Rest of the world for Vaccines: Historical Trends (since 2022) and Forecasted Estimates (till 2035)
- 35.2.4. Biologics Contract Manufacturing Market in Rest of the world for Cell Therapies: Historical Trends (since 2022) and Forecasted Estimates (till 2035)
- 35.2.5. Biologics Contract Manufacturing Market in Rest of the world for Gene Therapies: Historical Trends (since 2022) and Forecasted Estimates (till 2035)
- 35.2.6. Biologics Contract Manufacturing Market in Rest of the world for Other Biologics: Historical Trends (since 2022) and Forecasted Estimates (till 2035)
- 35.3. Biologics Contract Manufacturing Market in Rest of the world: Distribution by Type of Expression System Used
- 35.3.1. Biologics Contract Manufacturing Market in Rest of the world for Mammalian Expression Systems: Historical Trends (since 2022) and Forecasted Estimates (till 2035)
- 35.3.2. Biologics Contract Manufacturing Market in Rest of the world for Microbial Expression Systems: Historical Trends (since 2022) and Forecasted Estimates (till 2035)
- 35.3.3. Biologics Contract Manufacturing Market in Rest of the world for Other Expression Systems: Historical Trends (since 2022) and Forecasted Estimates (till 2035)
- 35.4. Biologics Contract Manufacturing Market: Distribution by Scale of Operation
- 35.4.1. Biologics Contract Manufacturing Market in Rest of the world for Preclinical / Clinical Scale: Historical Trends (since 2022) and Forecasted Estimates (till 2035)
- 35.4.2. Biologics Contract Manufacturing Market in Rest of the world for Commercial Scale: Historical Trends (since 2022) and Forecasted Estimates (till 2035)
- 35.5. Biologics Contract Manufacturing Market: Distribution by Company Size
- 35.5.1. Biologics Contract Manufacturing Market in Rest of the world for Small Companies: Historical Trends (since 2022) and Forecasted Estimates (till 2035)
- 35.5.2. Biologics Contract Manufacturing Market in Rest of the world for Mid-sized Companies: Historical Trends (since 2022) and Forecasted Estimates (till 2035)
- 35.5.3. Biologics Contract Manufacturing Market in Rest of the world for Large and Very Large Companies: Historical Trends (since 2022) and Forecasted Estimates (till 2035)
- 35.6. Biologics Contract Manufacturing Market: Distribution by Therapeutic Area
- 35.6.1. Biologics Contract Manufacturing Market in Rest of the world for Oncological Disorders: Historical Trends (since 2022) and Forecasted Estimates (till 2035)
- 35.6.2. Biologics Contract Manufacturing Market in Rest of the world for Cardiovascular Disorders: Historical Trends (since 2022) and Forecasted Estimates (till 2035)
- 35.6.3. Biologics Contract Manufacturing Market in Rest of the world for Metabolic Disorders: Historical Trends (since 2022) and Forecasted Estimates (till 2035)
- 35.6.4. Biologics Contract Manufacturing Market in Rest of the world for Infectious Diseases: Historical Trends (since 2022) and Forecasted Estimates (till 2035)
- 35.6.5. Biologics Contract Manufacturing Market in Rest of the world for Autoimmune Disorders: Historical Trends (since 2022) and Forecasted Estimates (till 2035)
- 35.6.6. Biologics Contract Manufacturing Market in Rest of the world for Neurological Disorders: Historical Trends (since 2022) and Forecasted Estimates (till 2035)
- 35.6.7. Biologics Contract Manufacturing Market in Rest of the world for Genetic Disorders: Historical Trends (since 2022) and Forecasted Estimates (till 2035)
- 35.6.8. Biologics Contract Manufacturing Market in Rest of the world for Other Disorders: Historical Trends (since 2022) and Forecasted Estimates (till 2035)
36. CASE STUDY: VIRTUAL PHARMACEUTICAL COMPANIES
- 36.1. Chapter Overview
- 36.2. Historical Evolution of the Virtual Business Model
- 36.3. Virtual Pharmaceutical Companies as a Subset of the Overall Biopharmaceutical Industry
- 36.4. Advantages Associated with Outsourcing Operations to Virtual Service Providers
- 36.5. Key Challenges Associated with Outsourcing Operations to Virtual Service Providers
37. FUTURE OF THE BIOPHARMACEUTICAL CMO MARKET
- 37.1. Chapter Overview
- 37.2. Outsourcing Activities to Witness Significant Growth in the Coming Years
- 37.3. Shift from One-time Contracts to Strategic Partnerships
- 37.4. Integration / Adoption of New and Innovative Technologies
- 37.4.1. Single-use Bioreactors
- 37.4.2. Novel Bioprocess Techniques
- 37.4.3. Bioprocess Automation
- 37.5. Focus on Prominent Therapeutic Areas
- 37.6. Growing Biosimilars Market to Contribute to the Growth of the Contract Services Segment
- 37.7. Capability Expansion by CMOs to become One-Stop-Shops
- 37.8. Offshoring Outsourcing Activities to Maximize Profits and Expand Existing Capacities
- 37.9. Increase in Financial Inflow and Outsourcing Budgets
- 37.10. Challenges Faced by Sponsors and Service Providers
- 37.10.1. Concerns Related to Single-use Systems
- 37.10.2. Issues Related to Capacity Fluctuations
- 37.11. Concluding Remarks
38. CONCLUSION
39. EXECUTIVE INSIGHTS
- 39.1. Chapter Overview
- 39.2. RoslinCT
- 39.2.1. Company Snapshot
- 39.2.2. Interview Transcript: Chief Executive Officer
- 39.3. JAFRAL Biosolutions
- 39.3.1. Company Snapshot
- 39.3.2. Interview Transcript: Chief Executive Officer and Co-Founder
- 39.4. Discovery Life Sciences
- 39.4.1. Company Snapshot
- 39.4.2. Interview Transcript: Former Chief Technical Officer, Cell and Gene Therapy
- 39.5. Bioworkshops
- 39.5.1. Company Snapshot
- 39.5.2. Interview Transcript: President and Chief Operating Officer
- 39.6. Aldevron
- 39.6.1. Company Snapshot
- 39.6.2. Interview Transcript: Former Senior Director of Global Strategic Marketing
- 39.7. Resilience
- 39.7.1. Company Snapshot
- 39.7.2. Interview Transcript: Former Senior Director of Commercial Strategy and Market Insights
- 39.8. Minaris Regenerative Medicine
- 39.8.1. Company Snapshot
- 39.8.2. Interview Transcript: Former Global Head of Sales and Marketing and Head of Business Development (Germany)
- 39.9. 53Biologics
- 39.9.1. Company Snapshot
- 39.9.2. Interview Transcript: Business Development Manager
- 39.10. Richter-Helm BioLogics
- 39.10.1. Company Snapshot
- 39.10.2. Interview Transcript: Manager Marketing and Sales
40. APPENDIX I: TABULATED DATA
41. APPENDIX II: LIST OF COMPANIES AND ORGANIZATIONS
List of Tables
- Table 6.1 Mammalian versus Microbial Expression Systems
- Table 7.1 List of Biopharmaceutical Contract Manufacturers: Information on Year of Establishment, Company Size, Location of Headquarters
- Table 7.2 Key Biopharmaceutical Contract Manufacturers: Information on Compliance and Type of Service Offered
- Table 7.3 Key Biopharmaceutical Contract Manufacturers: Information on Type of Biologic Manufactured
- Table 7.4 Key Biopharmaceutical Contract Manufacturers: Information on Scale of Operation and Type of Expression System Used
- Table 7.5 Key Biopharmaceutical Contract Manufacturers: Information on Type of Primary Container Offered
- Table 8.1 List of Biopharmaceutical Contract Manufacturing Facilities in North America
- Table 8.2 List of Biopharmaceutical Contract Manufacturing Facilities in Europe
- Table 8.3 List of Biopharmaceutical Contract Manufacturing Facilities in Asia-Pacific
- Table 8.4 List of Biopharmaceutical Contract Manufacturing Facilities in Rest of the World
- Table 9.1 Biopharmaceutical Contract Manufacturers: List of Companies Profiled
- Table 9.2 AbbVie: Company Overview
- Table 9.3 AbbVie: Service Portfolio
- Table 9.4 Agilent Technologies: Company Overview
- Table 9.5 Agilent Technologies: Service Portfolio
- Table 9.6 Catalent: Company Overview
- Table 9.7 Catalent: Service Portfolio
- Table 9.8 Boehringer Ingelheim: Company Overview
- Table 9.9 Boehringer Ingelheim: Service Portfolio
- Table 9.10 Eurofins: Company Overview
- Table 9.11 Eurofins: Service Portfolio
- Table 9.12 Fresenius Kabi: Company Overview
- Table 9.13 Fresenius Kabi: Service Portfolio
- Table 9.14 Lonza: Company Overview
- Table 9.15 Lonza: Service Portfolio
- Table 9.16 Novartis: Company Overview
- Table 9.17 Novartis: Service Portfolio
- Table 9.18 Sandoz: Company Overview
- Table 9.19 Sandoz: Service Portfolio
- Table 9.20 WACKER: Company Overview
- Table 9.21 WACKER: Service Portfolio
- Table 9.22 Cipla: Company Overview
- Table 9.23 Cipla: Service Portfolio
- Table 9.24 WuXi Biologics: Company Overview
- Table 9.25 WuXi Biologics: Service Portfolio
- Table 10.1 Bispecific Antibody Therapeutics: Information on Drug Candidate, Developer, Developer, Phase of Development and Target Antigen
- Table 10.2 Bispecific Antibody Therapeutics: Information on Clinical Drug Candidates, Target Indications, Therapeutic Areas and Disease Segments
- Table 10.3 Bispecific Antibody Therapeutics: Information on Preclinical Drug Candidate, Developer, Stage of Development and Target Antigen
- Table 10.4 Bispecific Antibody Contract Manufacturers: List of Companies
- Table 10.5 Commonly Used Cytotoxins for ADC Therapeutics
- Table 10.6 Occupational Exposure Limit Bands, Safebridge Consultants
- Table 10.7 Antibody-Drug Conjugates: Information on Developer, Stage of Development, Target Indication and Therapeutic Area
- Table 10.8 Antibody-Drug Conjugate Developers: Information on Year of Establishment, Location of Headquarters (Country / Region), and Company Size
- Table 10.9 ADC Contract Manufacturers: List of Companies
- Table 10.10 Cell-based Therapies: Applications
- Table 10.11 Cell-based Therapies: Commercialized Products
- Table 10.12 Assessments for Key Cell Therapy Manufacturing Steps
- Table 10.13 Advantages and Disadvantages of Centralized and Decentralized Manufacturing Models
- Table 10.14 Industry Players: Information on Type of Immune Cell Offered
- Table 10.15 Cell / Gene Therapy Contract Manufacturers: List of Companies
- Table 10.16 Viral Vector and Gene Therapy Manufacturers (Industry Players): Information on Type of Viral Vector Manufactured
- Table 10.17 Plasmid DNA Manufacturing Service Providers: Information on Location of Manufacturing Facility
- Table 10.18 Plasmid DNA Contract Manufacturers: List of Companies
- Table 11.1 List of Biosimilars Contract Manufacturing Service Providers
- Table 12.1 Small Molecules and Large Molecules: Strengths and Weaknesses
- Table 12.2 Small Molecules and Large Molecules: Comparison of Key Characteristics
- Table 12.3 Small Molecules and Large Molecules: Comparison of Development Characteristics
- Table 13.1 List of FDA Approved Biologics (2016-2024)
- Table 15.1 Biopharmaceutical Contract Manufacturing: List of Partnerships and Collaborations
- Table 15.2 Partnerships and Collaborations: Information on Scale of Operation and Therapeutic Area
- Table 15.3 Partnerships and Collaborations: Information on Location of Headquarters (Country and Region) and Type of Agreement (Country and Region)
- Table 16.1 Biopharmaceutical Contract Manufacturing: List of Funding and Investments, Q1 2024 - Q4 2025
- Table 17.1 Biopharmaceutical Contract Manufacturing Organizations: List of Mergers and Acquisitions, Q1 2024 - Q4 2025
- Table 17.2 Mergers and Acquisitions: Information on Key Value Drivers
- Table 18.1 Biopharmaceutical Contract Manufacturing: List of Expansions
- Table 19.1 List of Top Seven Big Pharma Players
- Table 19.2 Big Pharma Players: List of Biopharmaceutical Contract Manufacturing Focused Initiatives, Q1 2024 - Q4 2025
- Table 20.1 Biopharmaceutical Contract Manufacturers: Information on Mammalian and Microbial Production Capacities (Sample Dataset)
- Table 20.2 Biopharmaceutical Contract Manufacturing: Average Mammalian and Microbial Production Capacity Based on Company Size
- Table 20.3 Biopharmaceutical Contract Manufacturers: Information on Production Capacity (Sample Dataset)
- Table 20.4 Biopharmaceutical Contract Manufacturing: Average Production Capacity Based on Company Size (Sample Dataset)
- Table 20.5 Global Biopharmaceutical Contract Manufacturing Capacity: Distribution by Company Size (in liters)
- Table 22.1 Total Cost of Ownership: Sample Dataset for Mid-sized Companies
- Table 22.2 Total Cost of Ownership: Sample Dataset for Large / Very Large Companies
- Table 32.1 List of Virtual Biopharmaceutical Companies
- Table 35.1 RoslinCT: Key Highlights
- Table 35.2 JAFRAL Biosolutions: Key Highlights
- Table 35.3 Discovery Life Sciences: Key Highlights
- Table 35.4 Bioworkshops: Key Highlights
- Table 35.5 Aldevron: Key Highlights
- Table 35.6 Resilience: Key Highlights
- Table 35.7 Minaris Regenerative Medicine: Key Highlights
- Table 35.8 53Biologics: Key Highlights
- Table 35.9 Richter-Helm BioLogics: Key Highlights
- Table 40.1 Biopharmaceutical Contract Manufacturers: Distribution by Year of Establishment
- Table 40.2 Biopharmaceutical Contract Manufacturers: Distribution by Company Size
- Table 40.3 Biopharmaceutical CMOs: Distribution by Location of Headquarters (Region)
- Table 40.4 Biopharmaceutical Contract Manufacturers: Distribution by Location of Headquarters (Country)
- Table 40.5 Biopharmaceutical Contract Manufacturers: Distribution by Company Size and Location of Headquarters (Region)
- Table 40.6 Biopharmaceutical Contract Manufacturers: Distribution by Compliance
- Table 40.7 Biopharmaceutical Contract Manufacturers: Distribution by Type of Service Offered
- Table 40.8 Biopharmaceutical Contract Manufacturers: Distribution by Type of Biologic Manufactured
- Table 40.9 Biopharmaceutical Contract Manufacturers: Distribution by Scale of Operation
- Table 40.10 Biopharmaceutical Contract Manufacturers: Distribution by Type of Biologic Manufactured and Scale of Operation
- Table 40.11 Biopharmaceutical Contract Manufacturers: Distribution by Type of Expression System Used
- Table 40.12 Biopharmaceutical Contract Manufacturers: Distribution by Type of Primary Container Offered
- Table 40.13 Regional Distribution of Biopharmaceutical Contract Manufacturing Facilities
- Table 40.14 Biopharmaceutical Contract Manufacturing Facilities: Distribution of Type of Service Offered
- Table 40.15 Biopharmaceutical Contract Manufacturing Facilities: Distribution by Scale of Operation
- Table 40.16 Approved and Clinical Bispecific Antibody Therapeutics: Distribution by Phase of Development
- Table 40.17 Approved and Clinical Bispecific Antibody Therapeutics: Distribution by Target Indication
- Table 40.18 Preclinical Bispecific Antibody Therapeutics: Distribution by Stage of Development
- Table 40.19 Antibody-Drug Conjugates: Distribution by Stage of Development
- Table 40.20 Antibody-Drug Conjugates: Distribution by Target Indication
- Table 40.21 Most Active Players: Distribution by Number of Antibody-Drug Conjugates
- Table 40.22 Industry Players: Distribution by Type of Immune Cell Offered
- Table 40.23 Marketed and Clinical Stage Gene Therapies: Distribution by Stage of Development
- Table 40.24 Marketed and Clinical Stage Gene Therapies: Distribution by Type of Vector Used
- Table 40.25 Preclinical and Discovery Stage Gene Therapies: Distribution by Therapeutic Area
- Table 40.26 Viral Vector and Gene Therapy Manufacturers (Industry Players): Distribution by Location of Vector Manufacturing Facility (Region)
- Table 40.27 Viral Vector and Gene Therapy Manufacturers (Industry Players): Distribution by Type of Viral Vector Manufactured
- Table 40.28 Plasmid DNA Manufacturers: Distribution by Location of Manufacturing Facility
- Table 40.29 Biosimilars: Historical Trend of FDA Approvals, 2015-2025
- Table 40.30 Small Molecule and Large Molecule Drugs: Historical Trend of FDA Approval, 2005-2022
- Table 40.31 Partnerships and Collaborations: Cumulative Trend of Partnerships, Q1 2024 - Q4 2025
- Table 40.32 Partnerships and Collaborations: Distribution by Type of Partnership
- Table 40.33 Partnerships and Collaborations: Distribution of Quarter and Type of Partnership
- Table 40.34 Partnerships and Collaborations: Distribution by Type of Biologic Manufactured
- Table 40.35 Partnerships and Collaborations: Distribution by Scale of Operation
- Table 40.36 Partnerships and Collaborations: Distribution by Therapeutic Area
- Table 40.37 Most Active Players: Distribution by Number of Partnerships
- Table 40.38 Partnerships and Collaborations: Local and International Agreements
- Table 40.39 Partnerships and Collaborations: Intracontinental and Intercontinental Agreements
- Table 40.40 Funding and Investments: Cumulative Trend of Funding, Q1 2024 - Q4 2025
- Table 40.41 Funding and Investments: Cumulative Trend of Amount Invested, Q1 2024 - Q4 2025 (USD Million)
- Table 40.42 Funding and Investments: Distribution of Instances by Type of Funding
- Table 40.43 Funding and Investments: Distribution by Quarter and Type of Funding, Q1 2024 - Q4 2025 (USD Million)
- Table 40.44 Funding and Investments: Distribution of Amount Invested by Type of Funding (USD Million)
- Table 40.45 Funding and Investments: Distribution by Geography (Region)
- Table 40.46 Funding and Investments: Distribution by Geography (Country)
- Table 40.47 Most Active Players: Distribution by Number of Funding Instances
- Table 40.48 Most Active Players: Distribution by Amount Raised (USD Million)
- Table 40.49 Mergers and Acquisitions: Cumulative Trend of Mergers and Acquisitions, Q1 2024 - Q4 2025
- Table 40.50 Mergers and Acquisitions: Distribution by Type of Agreement
- Table 40.51 Mergers and Acquisitions: Distribution by Local and International Agreements
- Table 40.52 Mergers and Acquisitions: Distribution by Intracontinental and Intercontinental Agreements
- Table 40.53 Most Active Players: Distribution by Number of Agreements
- Table 40.54 Mergers and Acquisitions: Distribution by Ownership Change Matrix
- Table 40.55 Mergers and Acquisitions: Distribution by Key Value Drivers
- Table 40.56 Recent Expansions: Distribution by Cumulative Trend of Expansions
- Table 40.57 Recent Expansions: Distribution by Type of Expansion
- Table 40.58 Recent Expansions: Distribution by Year and Type of Expansion
- Table 40.59 Recent Expansions: Distribution by Location of Facility (Region)
- Table 40.60 Recent Expansions: Distribution by Location of Facility (Country)
- Table 40.61 Recent Expansions: Distribution by Distribution by Type of Expansion and Location of Facility (Region)
- Table 40.62 Recent Expansions: Distribution of Amount Invested by Year of Expansion
- Table 40.63 Recent Expansions: Distribution of Amount Invested by Type of Expansion
- Table 40.64 Most Active Players: Distribution by Number of Expansions
- Table 40.65 Most Active Players: Distribution by Amount Invested
- Table 40.66 Big Pharma Initiatives: Cumulative Trend of Initiatives
- Table 40.67 Big Pharma Initiatives: Distribution by Type of Initiative
- Table 40.68 Big Pharma Initiatives: Distribution by Quarter and Type of Initiative
- Table 40.69 Big Pharma Initiatives: Distribution of Big Pharma Players by Number of Initiatives
- Table 40.70 Big Pharma Initiatives: Distribution by Type of Partnership
- Table 40.71 Big Pharma Initiatives: Distribution of Big Pharma Players by Number of Partnerships
- Table 40.72 Big Pharma Initiatives: Distribution by Type of Acquisition
- Table 40.73 Big Pharma Initiatives: Distribution of Big Pharma Players by Number of Mergers and Acquisitions
- Table 40.74 Big Pharma Initiatives: Distribution of Big Pharma Players by Number of Expansions
- Table 40.75 Global Capacity of Biopharmaceutical Contract Manufacturers (in liters): Distribution by Company Size
- Table 40.76 Global Capacity of Biopharmaceutical Contract Manufacturers (in liters): Distribution by Type of Expression System Used
- Table 40.77 Global Capacity of Biopharmaceutical Contract Manufacturers (in liters): Distribution by Geography
- Table 40.78 Biopharmaceutical Contract Manufacturing Capacity in North America
- Table 40.79 Biopharmaceutical Contract Manufacturing Capacity in Europe
- Table 40.80 Biopharmaceutical Contract Manufacturing Capacity in Asia-Pacific
- Table 40.81 Biopharmaceutical Contract Manufacturing Capacity in Rest of the World
- Table 40.82 Global Demand for Biopharmaceutical Contract Manufacturing, Historical Trends (since 2024) and Forecasted Estimates (till 2035) (in million liters)
- Table 40.83 Global Demand for Biopharmaceuticals: Distribution by Scale of Operation, Historical Trends (since 2024) and Forecasted Estimates (till 2035) (in million liters)
- Table 40.84 Global Demand for ADC Therapeutics, Historical Trends (since 2024) and Forecasted Estimates (till 2035) (in kilograms)
- Table 40.85 Global Demand for Cell Therapy Manufacturing, Historical Trends (since 2024) and Forecasted Estimates (till 2035) (in terms of Number of Patients)
- Table 40.86 Global Demand for Cell Therapy Manufacturing, Historical Trends (since 2024) and Forecasted Estimates (till 2035) (in terms of Number of Cells)
- Table 40.87 Total Cost of Ownership for Mid-sized Biopharmaceutical Contract Manufacturing Organizations, Y0-Y20 (USD Million)
- Table 40.88 Total Cost of Ownership for Mid-sized Biopharmaceutical Contract Manufacturing Organizations, Y0: Distribution of CAPEX (USD Million)
- Table 40.89 Total Cost of Ownership for Mid-sized Biopharmaceutical Contract Manufacturing Organizations, Y1-Y20: Distribution by OPEX (USD Million)
- Table 40.90 Total Cost of Ownership for Large / Very Large Biopharmaceutical Contract Manufacturing Organizations, Y0-Y20 (USD Million)
- Table 40.91 Total Cost of Ownership for Mid-sized Biopharmaceutical Contract Manufacturing Organizations, Y0: Distribution of CAPEX (USD Million)
- Table 40.92 Total Cost of Ownership for Large / Very Large Biopharmaceutical Contract Manufacturing Organizations, Y1-Y20: Distribution by OPEX (USD Million)
- Table 40.93 Global Biologics Contract Manufacturing Market, Historical Trends (since 2022) and Forecasted Estimates (till 2035) (USD Billion)
- Table 40.94 Global Biologics Contract Manufacturing Market, Forecasted Estimates (till 2035), Optimistic Scenario (USD Billion)
- Table 40.95 Biologics Contract Manufacturing Market: Distribution by Type of Service Offered
- Table 40.96 Biologics Contract Manufacturing Market for Drug Substance (API) Manufacturing, Historical Trends (since 2022) and Forecasted Estimates (till 2035) (USD Billion)
- Table 40.97 Biologics Contract Manufacturing Market for Drug Product (FDF) Manufacturing, Historical Trends (since 2022) and Forecasted Estimates (till 2035) (USD Billion)
- Table 40.98 Biologics Contract Manufacturing Market: Distribution by Type of Biologic Manufactured
- Table 40.99 Biologics Contract Manufacturing Market for Antibodies, Historical Trends (since 2022) and Forecasted Estimates (till 2035) (USD Billion)
- Table 40.100 Biologics Contract Manufacturing Market for Proteins / Peptides, Historical Trends (since 2022) and Forecasted Estimates (till 2035) (USD Billion)
- Table 40.101 Biologics Contract Manufacturing Market for Vaccines, Historical Trends (since 2022) and Forecasted Estimates (till 2035) (USD Billion)
- Table 40.102 Biologics Contract Manufacturing Market for Cell Therapies, Historical Trends (since 2022) and Forecasted Estimates (2025-2035) (USD Billion)
- Table 40.103 Biologics Contract Manufacturing Market for Gene Therapies, Historical Trends (since 2022) and Forecasted Estimates (till 2035) (USD Billion)
- Table 40.104 Biologics Contract Manufacturing Market for Other Biologics, Historical Trends (since 2022) and Forecasted Estimates (till 2035) (USD Billion)
- Table 40.105 Biologics Contract Manufacturing Market: Distribution by Type of Expression System Used
- Table 40.106 Biologics Contract Manufacturing Market for Mammalian Expression Systems, Historical Trends (since 2022) and Forecasted Estimates (till 2035) (USD Billion)
- Table 40.107 Biologics Contract Manufacturing Market for Microbial Expression Systems, Historical Trends (since 2022) and Forecasted Estimates (till 2035) (USD Billion)
- Table 40.108 Biologics Contract Manufacturing Market for Other Expression Systems, Historical Trends (since 2022) and Forecasted Estimates (till 2035) (USD Billion)
- Table 40.109 Biologics Contract Manufacturing Market: Distribution by Scale of Operation
- Table 40.110 Biologics Contract Manufacturing Market for Preclinical / Clinical Scale, Historical Trends (since 2022) and Forecasted Estimates (till 2035) (USD Billion)
- Table 40.111 Biologics Contract Manufacturing Market for Commercial Scale, Historical Trends (since 2022) and Forecasted Estimates (till 2035) (USD Billion)
- Table 40.112 Biologics Contract Manufacturing Market: Distribution by Therapeutic Area
- Table 40.113 Biologics Contract Manufacturing Market for Oncological Disorders, Historical Trends (since 2022) and Forecasted Estimates (till 2035) (USD Billion)
- Table 40.114 Biologics Contract Manufacturing Market for Cardiovascular Disorders, Historical Trends (since 2022) and Forecasted Estimates (till 2035) (USD Billion)
- Table 40.115 Biologics Contract Manufacturing Market for Metabolic Disorders, Historical Trends (since 2022) and Forecasted Estimates (till 2035) (USD Billion)
- Table 40.116 Biologics Contract Manufacturing Market for Infectious Diseases, Historical Trends (since 2022) and Forecasted Estimates (till 2035) (USD Billion)
- Table 40.117 Biologics Contract Manufacturing Market for Autoimmune Disorders, Historical Trends (since 2022) and Forecasted Estimates (till 2035) (USD Billion)
- Table 40.118 Biologics Contract Manufacturing Market for Neurological Disorders, Historical Trends (since 2022) and Forecasted Estimates (till 2035) (USD Billion)
- Table 40.119 Biologics Contract Manufacturing Market for Genetic Disorders, Historical Trends (since 2022) and Forecasted Estimates (till 2035) (USD Billion)
- Table 40.120 Biologics Contract Manufacturing Market for Other Disorders, Historical Trends (since 2022) and Forecasted Estimates (till 2035) (USD Billion)
- Table 40.121 Biologics Contract Manufacturing Market: Distribution by Company Size
- Table 40.122 Biologics Contract Manufacturing Market for Small Companies, Historical Trends (since 2022) and Forecasted Estimates (till 2035) (USD Billion)
- Table 40.123 Biologics Contract Manufacturing Market for Mid-sized Companies, Historical Trends (since 2022) and Forecasted Estimates (till 2035) (USD Billion)
- Table 40.124 Biologics Contract Manufacturing Market for Large and Very Large Companies, Historical Trends (since 2022) and Forecasted Estimates (till 2035) (USD Billion)
- Table 40.125 Biologics Contract Manufacturing Market: Distribution by Key Geographical Regions
- Table 40.126 Biologics Contract Manufacturing Market in North America, Historical Trends (since 2022) and Forecasted Estimates (till 2035) (USD Billion)
- Table 40.127 Biologics Contract Manufacturing Market in the US, Historical Trends (since 2022) and Forecasted Estimates (till 2035) (USD Billion)
- Table 40.128 Biologics Contract Manufacturing Market in Canada, Historical Trends (since 2022) and Forecasted Estimates (till 2035) (USD Billion)
- Table 40.129 Biologics Contract Manufacturing Market in Puerto Rico, Historical Trends (since 2022) and Forecasted Estimates (till 2035) (USD Billion)
- Table 40.130 Biologics Contract Manufacturing Market in Europe, Historical Trends (since 2022) and Forecasted Estimates (till 2035) (USD Billion)
- Table 40.131 Biologics Contract Manufacturing Market in Germany, Historical Trends (since 2022) and Forecasted Estimates (till 2035) (USD Billion)
- Table 40.132 Biologics Contract Manufacturing Market in the UK, Historical Trends (since 2022) and Forecasted Estimates (till 2035) (USD Billion)
- Table 40.133 Biologics Contract Manufacturing Market in France, Historical Trends (since 2022) and Forecasted Estimates (till 2035) (USD Billion)
- Table 40.134 Biologics Contract Manufacturing Market in Spain, Historical Trends (since 2022) and Forecasted Estimates (till 2035) (USD Billion)
- Table 40.135 Biologics Contract Manufacturing Market in Italy, Historical Trends (since 2022) and Forecasted Estimates (till 2035) (USD Billion)
- Table 40.136 Biologics Contract Manufacturing Market in Rest of Europe, Historical Trends (since 2022) and Forecasted Estimates (till 2035) (USD Billion)
- Table 40.137 Biologics Contract Manufacturing Market in Asia-Pacific, Historical Trends (since 2022) and Forecasted Estimates (till 2035) (USD Billion)
- Table 40.138 Biologics Contract Manufacturing Market in China, Historical Trends (since 2022) and Forecasted Estimates (till 2035) (USD Billion)
- Table 40.139 Biologics Contract Manufacturing Market in South Korea, Historical Trends (since 2022) and Forecasted Estimates (till 2035) (USD Billion)
- Table 40.140 Biologics Contract Manufacturing Market in Japan, Historical Trends (since 2022) and Forecasted Estimates (till 2035) (USD Billion)
- Table 40.141 Biologics Contract Manufacturing Market in Singapore, Historical Trends (since 2022) and Forecasted Estimates (till 2035) (USD Billion)
- Table 40.142 Biologics Contract Manufacturing Market in Rest of the Asia-Pacific, Historical Trends (since 2022) and Forecasted Estimates (till 2035) (USD Billion)
- Table 40.143 Biologics Contract Manufacturing Market in Rest of the World, Historical Trends (since 2022) and Forecasted Estimates (till 2035) (USD Billion)
- Table 40.144 Biologics Contract Manufacturing Market in Israel, Historical Trends (since 2022) and Forecasted Estimates (till 2035) (USD Billion)
- Table 40.145 Biologics Contract Manufacturing Market in Argentina, Historical Trends (since 2022) and Forecasted Estimates (till 2035) (USD Billion)
- Table 40.146 Biologics Contract Manufacturing Market in Africa, Historical Trends (since 2022) and Forecasted Estimates (till 2035) (USD Billion)
- Table 40.147 Overall Share of Virtual Biopharmaceutical Companies in the Biopharmaceutical Market (USD Billion)
- Table 40.148 Overall Share of Virtual Biopharmaceutical Companies in the Biopharmaceutical Market in 2023 (USD Billion)
List of Figures
- Figure 2.1 Research Methodology: Project Methodology
- Figure 2.2 Research Methodology: Data Sources for Secondary Research
- Figure 2.3 Research Methodology: Robust Quality Control
- Figure 3.1 Market Dynamics: Forecast Methodology
- Figure 3.2 Market Dynamics: Market Assessment Framework
- Figure 4.1 Lessons Learnt from Past Recessions
- Figure 5.1 Executive Summary: Market Landscape
- Figure 5.2 Executive Summary: Market Trends
- Figure 5.3 Executive Summary: Market Forecast and Opportunity Analysis
- Figure 6.1 Types of Biopharmaceuticals
- Figure 6.2 Types of Expression Systems Used for the Production of Biopharmaceuticals
- Figure 6.3 Stages of the Biomanufacturing Process
- Figure 6.4 Types of Third Party Service Providers
- Figure 6.5 Commonly Outsourced Biopharmaceutical Contract Manufacturing Operations
- Figure 7.1 Biopharmaceutical Contract Manufacturers: Distribution by Year of Establishment
- Figure 7.2 Biopharmaceutical Contract Manufacturers: Distribution by Company Size
- Figure 7.3 Biopharmaceutical Contract Manufacturers: Distribution by Location of Headquarters (Region)
- Figure 7.4 Biopharmaceutical Contract Manufacturers: Distribution by Location of Headquarters (Country)
- Figure 7.5 Biopharmaceutical Contract Manufacturers: Distribution by Company Size and Location of Headquarters (Region)
- Figure 7.6 Key Biopharmaceutical Contract Manufacturers: Distribution by Compliance
- Figure 7.7 Key Biopharmaceutical Contract Manufacturers: Distribution by Type of Service Offered
- Figure 7.8 Key Biopharmaceutical Contract Manufacturers: Distribution by Type of Biologic Manufactured
- Figure 7.9 Key Biopharmaceutical Contract Manufacturers: Distribution by Scale of Operation
- Figure 7.10 Key Biopharmaceutical Contract Manufacturers: Distribution by Type of Biologic Manufactured and Scale of Operation
- Figure 7.11 Key Biopharmaceutical Contract Manufacturers: Distribution by Type of Expression System Used
- Figure 7.12 Key Biopharmaceutical Contract Manufacturers: Distribution by Type of Primary Container Offered
- Figure 8.1 Regional Distribution of Biopharmaceutical Contract Manufacturing Facilities
- Figure 8.2 Biopharmaceutical Contract Manufacturing Facilities: Distribution by Type of Service Offered
- Figure 8.3 Biopharmaceutical Contract Manufacturing Facilities: Distribution by Scale of Operation
- Figure 8.4 Regional Capability Analysis: Biopharmaceutical Contract Manufacturing Facilities in North America
- Figure 8.5 Regional Capability Analysis: Biopharmaceutical Contract Manufacturing Facilities in Europe
- Figure 8.6 Regional Capability Analysis: Biopharmaceutical Contract Manufacturing Facilities in Asia-Pacific
- Figure 8.7 Regional Capability Analysis: Biopharmaceutical Contract Manufacturing Facilities in Rest of the World
- Figure 10.1 Basic Structure of an Antibody
- Figure 10.2 Approved and Clinical Bispecific Antibody Therapeutics: Distribution by Phase of Development
- Figure 10.3 Approved and Clinical Bispecific Antibody Therapeutics: Distribution by Target indication
- Figure 10.4 Preclinical Bispecific Antibody Therapeutics: Distribution by Stage of Development
- Figure 10.5 Structure of an Antibody Drug Conjugate (ADC)
- Figure 10.6 Antibody-Drug Conjugates: Distribution by Stage of Development
- Figure 10.7 Antibody-Drug Conjugates: Distribution by Target Indication
- Figure 10.8 Most Active Players: Distribution by Number of Antibody-Drug Conjugates
- Figure 10.9 Decentralized Manufacturing: Process Model
- Figure 10.10 Cell Therapy Manufacturing: Types of Manufacturers
- Figure 10.11 Cell Therapies: Challenges and Drivers
- Figure 10.12 Cell Therapies: Potency as Critical Quality Attribute
- Figure 10.13 Industry Players: Distribution by Type of Immune Cell Offered
- Figure 10.14 Marketed and Clinical Stage Gene Therapies: Distribution by Stage of Development
- Figure 10.15 Marketed and Clinical Stage Gene Therapies: Distribution by Type of Vector Used
- Figure 10.16 Marketed and Clinical Stage Gene Therapies: Distribution by Therapeutic Area
- Figure 10.17 Viral Vector and Gene Therapy Manufacturers (Industry Players): Distribution by Location of Vector Manufacturing Facility (Region)
- Figure 10.18 Viral Vector and Gene Therapy Manufacturers (Industry Players): Distribution by Type of Viral Vector Manufactured
- Figure 10.19 Plasmid DNA Manufacturers: Distribution by Location of Manufacturing Facility
- Figure 11.1 Manufacturing Stages of a Biosimilar Product
- Figure 11.2 Analytical and Functional Characterization Methods for Key Biosimilar Product
- Figure 11.3 Regulatory Process Adopted for Licensing of a Biosimilar Product
- Figure 11.4 Need for Outsourcing Biosimilar Manufacturing Operations
- Figure 11.5 Biosimilars: Historical Trend of FDA Approvals, 2015-2025
- Figure 11.6 Challenges Associated with Outsourcing Biosimilar Manufacturing Operations
- Figure 12.1 Small Molecule and Large Molecule Drugs: Historical Trend of FDA Approval, 2005-2024
- Figure 12.2 Small Molecules versus Large Molecules: Comparison of Manufacturing Process
- Figure 13.1 Benefits Associated with In-House Manufacturing
- Figure 13.2 Risks Associated with In-House Manufacturing
- Figure 13.3 Advantages and Disadvantages of Different Types of Outsourcing Partnerships
- Figure 14.1 Make versus Buy Decision Making Framework
- Figure 14.2 Make versus Buy Decision Making Framework: Possible Scenarios
- Figure 15.1 Partnerships and Collaborations: Cumulative Trend of Partnerships, Q1 2024 - Q4 2025
- Figure 15.2 Partnerships and Collaborations: Distribution by Type of Partnership
- Figure 15.3 Partnerships and Collaborations: Distribution by Quarter and Type of Partnership
- Figure 15.4 Partnerships and Collaborations: Distribution by Type of Biologic Manufactured
- Figure 15.5 Partnerships and Collaborations: Distribution by Scale of Operation
- Figure 15.6 Partnerships and Collaborations: Distribution by Therapeutic Area
- Figure 15.7 Most Active Players: Distribution by Number of Partnerships
- Figure 15.8 Partnerships and Collaborations: Local and International Agreements
- Figure 15.9 Partnerships and Collaborations: Intracontinental and Intercontinental Agreements
- Figure 16.1 Funding and Investments Analysis: Cumulative Trend of Funding, Q1 2024 - Q4 2025
- Figure 16.2 Funding and Investments Analysis: Cumulative Trend of Amount Invested, Q1 2024 - Q4 2025 (USD Million)
- Figure 16.3 Funding and Investment Analysis: Distribution of Instances by Type of Funding
- Figure 16.4 Funding and Investment Analysis: Distribution by Quarter and Type of Funding, Q1 2024 - Q4 2025
- Figure 16.5 Funding and Investment Analysis: Distribution of Amount Invested by Type of Funding (USD Million)
- Figure 16.6 Funding and Investment Analysis: Distribution of Amount Invested by Quarter and Type of Funding, Q1 2024 - Q4 2025
- Figure 16.7 Funding and Investment Analysis: Distribution by Geography (Region)
- Figure 16.8 Funding and Investment Analysis: Distribution by Geography (Country)
- Figure 16.9 Most Active Players: Distribution by Number of Funding Instances
- Figure 16.10 Most Active Players: Distribution by Amount Raised (USD Million)
- Figure 17.1 Mergers and Acquisitions: Cumulative Trend of Mergers and Acquisitions, Q1 2024 - Q4 2025
- Figure 17.2 Mergers and Acquisitions: Distribution by Type of Agreement
- Figure 17.3 Mergers and Acquisitions: Distribution by Local and International Agreements
- Figure 17.4 Mergers and Acquisitions: Intracontinental and Intercontinental Agreements
- Figure 17.5 Most Active Players: Analysis by Number of Agreements
- Figure 17.6 Mergers and Acquisitions: Ownership Change Matrix
- Figure 17.7 Mergers and Acquisitions: Key Value Drivers
- Figure 18.1 Recent Expansions: Cumulative Trend of Expansions, Q1 2024 - Q4 2025
- Figure 18.2 Recent Expansions: Distribution by Type of Expansion
- Figure 18.3 Recent Expansions: Distribution by Quarter and Type of Expansion
- Figure 18.4 Recent Expansions: Distribution by Location of Facility (Region)
- Figure 18.5 Recent Expansions: Distribution by Location of Facility (Country)
- Figure 18.6 Recent Expansions: Distribution by Type of Expansion and Location of Facility (Region)
- Figure 18.7 Recent Expansions: Distribution of Amount Invested by Quarter of Expansion
- Figure 18.8 Recent Expansions: Distribution of Amount Invested by Type of Expansion
- Figure 18.9 Most Active Players: Distribution by Number of Expansions
- Figure 18.10 Most Active Players: Distribution by Amount Invested
- Figure 19.1 Big Pharma Initiatives: Cumulative Trend of Big Pharma Initiatives
- Figure 19.2 Big Pharma Initiatives: Distribution by Type of Initiative
- Figure 19.3 Big Pharma Initiatives: Distribution by Quarter and Type of Initiative
- Figure 19.4 Big Pharma Initiatives: Distribution of Big Pharma Players by Number of Initiatives
- Figure 19.5 Big Pharma Initiatives: Distribution by Type of Partnership
- Figure 19.6 Big Pharma Initiatives: Distribution of Big Pharma Players by Number of Partnerships
- Figure 19.7 Big Pharma Initiatives: Distribution by Type of Acquisition
- Figure 19.8 Big Pharma Initiatives: Distribution of Big Pharma Players by Number of Mergers and Acquisitions
- Figure 19.9 Big Pharma Initiatives: Distribution of Big Pharma Players by Number of Expansions
- Figure 19.10 Big Pharma Initiatives Summary
- Figure 20.1 Global Capacity of Biopharmaceutical Contract Manufacturers (in liters): Distribution by Company Size
- Figure 20.2 Global Capacity of Biopharmaceutical Contract Manufacturers (in liters): Distribution by Type of Expression System Used
- Figure 20.3 Global Capacity of Biopharmaceutical Contract Manufacturers (in liters): Distribution by Geography
- Figure 20.4 Biopharmaceutical Contract Manufacturing Capacity in North America
- Figure 20.5 Biopharmaceutical Contract Manufacturing Capacity in Europe
- Figure 20.6 Biopharmaceutical Contract Manufacturing Capacity in Asia-Pacific
- Figure 20.7 Capacity Analysis: Biopharmaceutical Contract Manufacturing Capacity in Rest of the World
- Figure 21.1 Global Demand for Biopharmaceutical Contract Manufacturing, Historical Trends (since 2024) and Forecasted Estimates (till 2035) (in million liters)
- Figure 21.2 Global Demand for Biopharmaceutical Contract Manufacturing: Distribution by Scale of Operation, Historical Trends (since 2024) and Forecasted Estimates (till 2035) (in million liters)
- Figure 21.3 Global Demand for ADC Therapeutics, Historical Trends (since 2024) and Forecasted Estimates (till 2035) (in kilograms)
- Figure 21.4 Global Demand for Cell Therapy Manufacturing, Historical Trends (since 2024) and Forecasted Estimates (till 2035) (in terms of Number of Patients)
- Figure 21.5 Global Demand for Cell Therapy Manufacturing, Historical Trends (since 2024) and Forecasted Estimates (till 2035) (in terms of Number of Cells in Billion)
- Figure 22.1 Total Cost of Ownership: Capital Expenditures (CAPEX)
- Figure 22.2 Total Cost of Ownership: Operational Expenditures (OPEX)
- Figure 22.3 Total Cost of Ownership for Mid-sized Biopharmaceutical Contract Manufacturing Organizations, Y0-Y20 (USD Million)
- Figure 22.4 Total Cost of Ownership for Mid-sized Biopharmaceutical Contract Manufacturing Organizations, Y0: Distribution by CAPEX (USD Million)
- Figure 22.5 Total Cost of Ownership for Mid-sized Biopharmaceutical Contract Manufacturing Organizations, Y1-Y20: Distribution by OPEX (USD Million)
- Figure 22.6 Total Cost of Ownership for Large / Very Large Biopharmaceutical Contract Manufacturing Organizations, Y0-Y20 (USD Million)
- Figure 22.7 Total Cost of Ownership for Large / Very Large Biopharmaceutical Contract Manufacturing Organizations, Y0: Distribution by CAPEX (USD Million)
- Figure 22.8 Total Cost of Ownership for Large / Very Large Biopharmaceutical Contract Manufacturing Organizations, Y1-Y20: Distribution by OPEX (USD Million)
- Figure 23.1 Biopharmaceutical Contract Manufacturing: SWOT Analysis
- Figure 23.2 Comparison of SWOT Factors: Harvey Ball Analysis
- Figure 24.1 Global Biologics Contract Manufacturing Market, Historical Trends (since 2022) and Forecasted Estimates (till 2035) (USD Billion)
- Figure 24.2 Global Biologics Contract Manufacturing Market, Forecasted Estimates (till 2035), Conservative Scenario (USD Billion)
- Figure 24.3 Global Biologics Contract Manufacturing Market, Forecasted Estimates (till 2035), Optimistic Scenario (USD Billion)
- Figure 25.1 Biologics Contract Manufacturing Market: Distribution by Type of Service Offered
- Figure 25.2 Biologics Contract Manufacturing Market for Drug Substance (API) Manufacturing, Historical Trends (since 2022) and Forecasted Estimates (till 2035) (USD Billion)
- Figure 25.3 Biologics Contract Manufacturing Market for Drug Product (FDF) Manufacturing, Historical Trends (since 2022) and Forecasted Estimates (till 2035) (USD Billion)
- Figure 26.1 Biologics Contract Manufacturing Market: Distribution by Type of Biologic Manufactured
- Figure 26.2 Biologics Contract Manufacturing Market for Antibodies, Historical Trends (since 2022) and Forecasted Estimates (till 2035) (USD Billion)
- Figure 26.3 Biologics Contract Manufacturing Market for Proteins / Peptides, Historical Trends (since 2022) and Forecasted Estimates (till 2035) (USD Billion)
- Figure 26.4 Biologics Contract Manufacturing Market for Vaccines, Historical Trends (since 2022) and Forecasted Estimates (till 2035) (USD Billion)
- Figure 26.5 Biologics Contract Manufacturing Market for Cell Therapies, Historical Trends (since 2022) and Forecasted Estimates (till 2035) (USD Billion)
- Figure 26.6 Biologics Contract Manufacturing Market for Gene Therapies, Historical Trends (since 2022) and Forecasted Estimates (till 2035) (USD Billion)
- Figure 26.7 Biologics Contract Manufacturing Market for Other Biologics, Historical Trends (since 2022) and Forecasted Estimates (till 2035) (USD Billion)
- Figure 27.1 Biologics Contract Manufacturing Market: Distribution by Type of Expression System Used
- Figure 27.2 Biologics Contract Manufacturing Market for Mammalian Expression Systems, Historical Trends (since 2022) and Forecasted Estimates (till 2035) (USD Billion)
- Figure 27.3 Biologics Contract Manufacturing Market for Microbial Expression System, Historical Trends (since 2022) and Forecasted Estimates (till 2035) (USD Billion)
- Figure 27.4 Biologics Contract Manufacturing Market for Other Expression System, Historical Trends (since 2022) and Forecasted Estimates (till 2035) (USD Billion)
- Figure 28.1 Biologics Contract Manufacturing Market: Distribution by Scale of Operation
- Figure 28.2 Biologics Contract Manufacturing Market for Preclinical / Clinical Scale, Historical Trends (since 2022) and Forecasted Estimates (till 2035) (USD Billion)
- Figure 28.3 Biologics Contract Manufacturing Market for Commercial Scale, Historical Trends (since 2022) and Forecasted Estimates (till 2035) (USD Billion)
- Figure 29.1 Biologics Contract Manufacturing Market: Distribution by Therapeutic Area
- Figure 29.2 Biologics Contract Manufacturing Market for Oncological Disorders, Historical Trends (since 2022) and Forecasted Estimates (till 2035) (USD Billion)
- Figure 29.3 Biologics Contract Manufacturing Market for Cardiovascular Disorders, Historical Trends (since 2022) and Forecasted Estimates (till 2035) (USD Billion)
- Figure 29.4 Biologics Contract Manufacturing Market for Metabolic Disorders, Historical Trends (since 2022) and Forecasted Estimates (till 2035) (USD Billion)
- Figure 29.5 Biologics Contract Manufacturing Market for Infectious Diseases, Historical Trends (since 2022) and Forecasted Estimates (till 2035) (USD Billion)
- Figure 29.6 Biologics Contract Manufacturing Market for Autoimmune Disorders, Historical Trends (since 2022) and Forecasted Estimates (till 2035) (USD Billion)
- Figure 29.7 Biologics Contract Manufacturing Market for Neurological Disorders, Historical Trends (since 2022) and Forecasted Estimates (till 2035) (USD Billion)
- Figure 29.8 Biologics Contract Manufacturing Market for Genetic Disorders, Historical Trends (since 2022) and Forecasted Estimates (till 2035) (USD Billion)
- Figure 29.9 Biologics Contract Manufacturing Market for Other Disorders, Historical Trends (since 2022) and Forecasted Estimates (till 2035) (USD Billion)
- Figure 30.1 Biologics Contract Manufacturing Market: Distribution by Company Size
- Figure 30.2 Biologics Contract Manufacturing Market for Small Companies, Historical Trends (since 2022) and Forecasted Estimates (till 2035) (USD Billion)
- Figure 30.3 Biologics Contract Manufacturing Market for Mid-sized Companies, Historical Trends (since 2022) and Forecasted Estimates (till 2035) (USD Billion)
- Figure 30.4 Biologics Contract Manufacturing Market for Large and Very Large Companies, Historical Trends (since 2022) and Forecasted Estimates (till 2035) (USD Billion)
- Figure 31.1 Biologics Contract Manufacturing Market: Distribution by Key Geographical Regions
- Figure 31.2 Biologics Contract Manufacturing Market in North America, Historical Trends (since 2022) and Forecasted Estimates (till 2035) (USD Billion)
- Figure 31.3 Biologics Contract Manufacturing Market in the US, Historical Trends (since 2022) and Forecasted Estimates (till 2035) (USD Billion)
- Figure 31.4 Biologics Contract Manufacturing Market in Canada, Historical Trends (since 2022) and Forecasted Estimates (till 2035) (USD Billion)
- Figure 31.5 Biologics Contract Manufacturing Market in Puerto Rico, Historical Trends (since 2022) and Forecasted Estimates (till 2035) (USD Billion)
- Figure 31.6 Biologics Contract Manufacturing Market in Europe, Historical Trends (since 2022) and Forecasted Estimates (till 2035) (USD Billion)
- Figure 31.7 Biologics Contract Manufacturing Market in Germany, Historical Trends (since 2022) and Forecasted Estimates (till 2035) (USD Billion)
- Figure 31.8 Biologics Contract Manufacturing Market in the UK, Historical Trends (since 2022) and Forecasted Estimates (till 2035) (USD Billion)
- Figure 31.9 Biologics Contract Manufacturing Market in France, Historical Trends (since 2022) and Forecasted Estimates (till 2035) (USD Billion)
- Figure 31.10 Biologics Contract Manufacturing Market in Spain, Historical Trends (since 2022) and Forecasted Estimates (till 2035) (USD Billion)
- Figure 31.11 Biologics Contract Manufacturing Market in Italy, Historical Trends (since 2022) and Forecasted Estimates (till 2035) (USD Billion)
- Figure 31.12 Biologics Contract Manufacturing Market in Rest of Europe, Historical Trends (since 2022) and Forecasted Estimates (till 2035) (USD Billion)
- Figure 31.13 Biologics Contract Manufacturing Market in Asia-Pacific, Historical Trends (since 2022) and Forecasted Estimates (till 2035) (USD Billion)
- Figure 31.14 Biologics Contract Manufacturing Market in China, Historical Trends (since 2022) and Forecasted Estimates (till 2035) (USD Billion)
- Figure 31.15 Biologics Contract Manufacturing Market in South Korea, Historical Trends (since 2022) and Forecasted Estimates (till 2035) (USD Billion)
- Figure 31.16 Biologics Contract Manufacturing Market in Japan, Historical Trends (since 2022) and Forecasted Estimates (till 2035) (USD Billion)
- Figure 31.17 Biologics Contract Manufacturing Market in Singapore, Historical Trends (since 2022) and Forecasted Estimates (till 2035) (USD Billion)
- Figure 31.18 Biologics Contract Manufacturing Market in Rest of Asia-Pacific, Historical Trends (since 2022) and Forecasted Estimates (till 2035) (USD Billion)
- Figure 31.19 Biologics Contract Manufacturing Market in Rest of the World, Historical Trends (since 2022) and Forecasted Estimates (till 2035) (USD Billion)
- Figure 31.20 Biologics Contract Manufacturing Market in Israel, Historical Trends (since 2022) and Forecasted Estimates (till 2035) (USD Billion)
- Figure 31.21 Biologics Contract Manufacturing Market in Argentina, Historical Trends (since 2022) and Forecasted Estimates (till 2035) (USD Billion)
- Figure 31.22 Biologics Contract Manufacturing Market in Africa, Historical Trends (since 2022) and Forecasted Estimates (till 2035) (USD Billion)
- Figure 31.23 Market Movement Analysis: Key Geographical Regions
- Figure 31.24 Penetration-Growth (P-G) Matrix: Key Geographical Regions
- Figure 36.1 Overall Share of Virtual Biopharmaceutical Companies in the Biopharmaceutical Market (USD Billion)
- Figure 36.2 Overall Share of Virtual Biopharmaceutical Companies in the Biologics Contract Manufacturing Market in 2023 (USD Billion)
- Figure 38.1 Concluding Remarks: Overall Market Landscape
- Figure 38.2 Concluding Remarks: Partnerships and Collaborations
- Figure 38.3 Concluding Remarks: Funding and Investments
- Figure 38.4 Concluding Remarks: Mergers and Acquisitions
- Figure 38.5 Concluding Remarks: Recent Expansions
- Figure 38.6 Concluding Remarks: Capacity Analysis
- Figure 38.7 Concluding Remarks: Demand Analysis
- Figure 38.8 Concluding Remarks: Market Forecast and Opportunity Analysis (I/II)
- Figure 38.9 Concluding Remarks: Market Forecast and Opportunity Analysis (II/II)

