
PUBLISHER: Global Market Insights Inc. | PRODUCT CODE: 1885909

PUBLISHER: Global Market Insights Inc. | PRODUCT CODE: 1885909
Vehicle as a Service Market Opportunity, Growth Drivers, Industry Trend Analysis, and Forecast 2025 - 2034
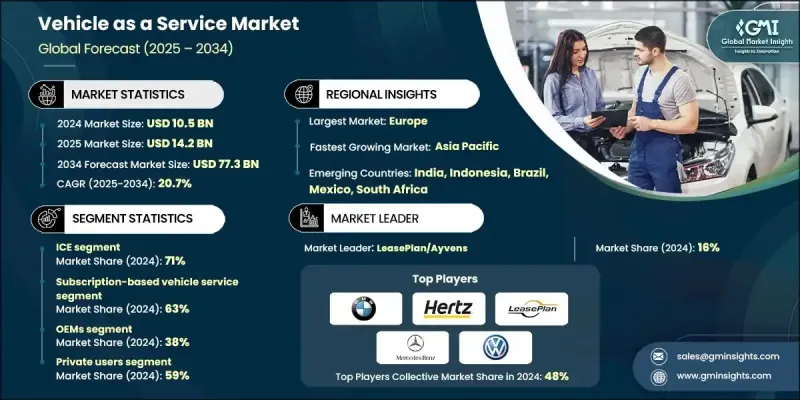
The Global Vehicle as a Service Market was valued at USD 10.5 billion in 2024 and is estimated to grow at a CAGR of 20.7% to reach USD 77.3 billion by 2034.
Consumers and businesses are increasingly prioritizing access to vehicles without the burdens of ownership, such as long-term commitments, insurance, maintenance, and high purchase costs. Subscription and pay-per-use models are meeting these needs by providing flexible, on-demand mobility solutions. Rising urbanization, tech-savvy populations, and the increasing integration of digital platforms are driving adoption, especially in metropolitan areas. The global push toward electric vehicles (EVs) is further accelerating VaaS growth, as EV fleets offer lower operational costs, environmental benefits, and potential government incentives. Organizations are also leveraging Fleet-as-a-Service models to reduce operational complexity and avoid capital expenditure, gaining access to vehicles while outsourcing maintenance, insurance, and fleet management. As urban mobility evolves, VaaS is emerging as a strategic tool for cost efficiency, sustainability, and convenience.
| Market Scope | |
|---|---|
| Start Year | 2024 |
| Forecast Year | 2025-2034 |
| Start Value | $10.5 Billion |
| Forecast Value | $77.3 Billion |
| CAGR | 20.7% |
The subscription-based vehicle service segment held a 63% share in 2024 and is expected to grow at a CAGR of 20.2% through 2034. Subscription models provide flexible, bundled, and commitment-free vehicle access, appealing to both consumers and businesses. Pay-per-use services target occasional users, offering cost-per-trip pricing optimized by demand algorithms. Integrated mobility platforms now combine VaaS with public transit and micromobility solutions, enabling seamless multimodal planning and unified payments.
The automotive OEMs segment held a 38% share in 2024 and is forecast to grow at a CAGR of 20.1% through 2034. OEMs are capitalizing on brand trust, dealer networks, and vehicle supply to launch mobility services. Auto-tech platforms are driving growth with digital-first solutions, streamlining vehicle access, and enhancing customer experience.
U.S. Vehicle as a Service Market reached USD 2.74 billion in 2024. Growing consumer preference for mobility without ownership is boosting subscription and pay-per-use models. These options reduce barriers to vehicle access, offer flexibility in vehicle type selection, and optimize fleet utilization, while generating recurring revenue and increasing customer engagement for providers.
Key players in the Vehicle as a Service Market include BMW, Hyundai, Mercedes-Benz, Volkswagen, Sixt, Hertz, LeasePlan/Ayvens, and Care by Volvo. To strengthen their position, companies in the Vehicle as a Service Market are focusing on expanding subscription and pay-per-use offerings, integrating EVs into fleets, and leveraging digital platforms for seamless customer experience. They are building strategic alliances with automotive manufacturers, tech firms, and mobility providers to scale operations and enhance service coverage. Fleet optimization, predictive maintenance, and dynamic pricing models are being adopted to maximize profitability, while investments in EV infrastructure and sustainability programs reinforce long-term growth. Companies are also using targeted marketing campaigns, loyalty programs, and personalized service options to attract and retain customers, ensuring a stronger market foothold and competitive advantage.
Table of Contents
Chapter 1 Methodology
- 1.1 Market scope and definition
- 1.2 Research design
- 1.2.1 Research approach
- 1.2.2 Data collection methods
- 1.3 Data mining sources
- 1.3.1 Global
- 1.3.2 Regional/Country
- 1.4 Base estimates and calculations
- 1.4.1 Base year calculation
- 1.4.2 Key trends for market estimation
- 1.5 Primary research and validation
- 1.5.1 Primary sources
- 1.6 Forecast model
- 1.7 Research assumptions and limitations
Chapter 2 Executive Summary
- 2.1 Industry 3600 synopsis
- 2.2 Key market trends
- 2.2.1 Regional
- 2.2.2 Engine
- 2.2.3 Service model
- 2.2.4 Service provider
- 2.2.5 End use
- 2.2.6 Vehicle
- 2.3 TAM analysis, 2025-2034
- 2.4 CXO perspectives: Strategic imperatives
- 2.4.1 Executive decision points
- 2.4.2 Critical success factors
- 2.5 Future outlook
- 2.6 Strategic recommendations
Chapter 3 Industry Insights
- 3.1 Industry ecosystem analysis
- 3.1.1 Supplier landscape
- 3.1.2 Profit margin
- 3.1.3 Cost structure
- 3.1.4 Value addition at each stage
- 3.1.5 Factor affecting the value chain
- 3.1.6 Disruptions
- 3.2 Industry impact forces
- 3.2.1 Growth drivers
- 3.2.1.1 Preference for flexible mobility over ownership
- 3.2.1.2 Growing EV adoption and fleet electrification
- 3.2.1.3 Rising corporate fleet demand
- 3.2.1.4 Connected vehicle and telematics advancements
- 3.2.2 Industry pitfalls and challenges
- 3.2.2.1 High capital investment
- 3.2.2.2 Regulatory and insurance challenges
- 3.2.3 Market opportunities
- 3.2.3.1 Expansion in emerging urban markets
- 3.2.3.2 Integration with smart cities and MaaS platforms
- 3.2.3.3 Bundled services with insurance and maintenance
- 3.2.3.4 Specialized EV and commercial vehicle solutions
- 3.2.1 Growth drivers
- 3.3 Growth potential analysis
- 3.4 Regulatory landscape
- 3.4.1 North America
- 3.4.2 Europe
- 3.4.3 Asia Pacific
- 3.4.4 Latin America
- 3.4.5 Middle East & Africa
- 3.5 Porter's analysis
- 3.6 PESTEL analysis
- 3.7 Technology and innovation landscape
- 3.7.1 Current technological trends
- 3.7.1.1 Telematics & IoT integration
- 3.7.1.2 Artificial intelligence & predictive analytics
- 3.7.1.3 Autonomous driving systems (SAE Level 3-5)
- 3.7.2 Emerging technologies
- 3.7.2.1 Digital key & keyless access technologies
- 3.7.2.2 Blockchain for smart contracts & payments
- 3.7.2.3 5G connectivity & V2X communication
- 3.7.1 Current technological trends
- 3.8 Price trends
- 3.8.1 Pricing model clarity
- 3.8.1.1 Per-minute vs hourly vs daily pricing
- 3.8.1.2 Subscription tiers & hidden fees
- 3.8.1.3 Dynamic/surge pricing perceptions
- 3.8.1.4 All-inclusive vs itemized pricing
- 3.8.2 Price sensitivity
- 3.8.3 Total cost of ownership (TCO)
- 3.8.4 Pricing models by service type
- 3.8.5 Cost comparison: ownership vs VaaS
- 3.8.6 Dynamic/surge pricing mechanisms
- 3.8.7 Subscription tier evaluation
- 3.8.8 Pricing variations across regions
- 3.8.1 Pricing model clarity
- 3.9 Cost breakdown analysis
- 3.10 Patent analysis
- 3.11 Sustainability and environmental aspects
- 3.11.1 Sustainable practices
- 3.11.2 Waste reduction strategies
- 3.11.3 Energy efficiency in production
- 3.11.4 Eco-friendly initiatives
- 3.11.5 Carbon footprint considerations
- 3.12 Consumer behavior & adoption patterns
- 3.12.1 Demographic analysis
- 3.12.2 Motivations for VaaS adoption
- 3.12.3 Barriers to adoption
- 3.12.4 Usage frequency & trip patterns
- 3.12.5 Multi-modal mobility behavior
- 3.12.6 Brand loyalty & switching
- 3.13 Digital transformation & data analytics
- 3.13.1 Telematics & IoT data
- 3.13.2 Predictive Analytics & ML
- 3.13.3 Big data infrastructure
- 3.13.4 Data privacy & security
- 3.13.5 API economy & integration
- 3.14 Customer acquisition & retention economics
- 3.14.1 Customer Acquisition Cost (CAC)
- 3.14.2 Customer Lifetime Value (LTV)
- 3.14.3 Unit economics & profitability
- 3.14.4 Churn & retention
- 3.14.5 Loyalty programs
- 3.14.6 Subsidy dependency
- 3.15 Supply chain vulnerabilities & risks
- 3.15.1 Vehicle procurement risks
- 3.15.2 EV battery risks
- 3.15.3 Charging infrastructure risks
- 3.15.4 Technology & software risks
- 3.15.5 Maintenance & service risks
- 3.15.6 Geopolitical & regulatory risks
Chapter 4 Competitive Landscape, 2024
- 4.1 Introduction
- 4.2 Company market share analysis
- 4.2.1 North America
- 4.2.2 Europe
- 4.2.3 Asia Pacific
- 4.2.4 LATAM
- 4.2.5 MEA
- 4.3 Competitive analysis of major market players
- 4.4 Competitive positioning matrix
- 4.5 Strategic outlook matrix
- 4.6 Key developments
- 4.6.1 Mergers & acquisitions
- 4.6.2 Partnerships & collaborations
- 4.6.3 New product launches
- 4.6.4 Expansion plans and funding
- 4.7 Product and service benchmarking
- 4.7.1 Service model comparison
- 4.7.2 Pricing structure analysis
- 4.7.3 Technology platform capabilities
- 4.7.4 Customer experience and user interface
- 4.7.5 Vehicle fleet composition and quality
- 4.8 Vendor selection criteria
Chapter 5 Market Estimates & Forecast, By Engine, 2021 - 2034 ($Mn)
- 5.1 Key trends
- 5.2 Electric vehicles (EVs)
- 5.2.1 Battery electric vehicles (BEVs)
- 5.2.2 Plug-in hybrid electric vehicles (PHEVs)
- 5.3 Internal combustion engine (ICE) vehicles
- 5.3.1 Gasoline
- 5.3.2 Diesel
Chapter 6 Market Estimates & Forecast, By Service Model, 2021 - 2034 ($Mn)
- 6.1 Key trends
- 6.2 Subscription-based vehicle service
- 6.3 Pay-per-use / usage-based vehicle service
- 6.4 Fleet-as-a-service (FaaS)
- 6.5 EV-as-a-service
- 6.6 Integrated mobility-as-a-service (MaaS)
Chapter 7 Market Estimates & Forecast, By Service Provider, 2021 - 2034 ($Mn)
- 7.1 Key trends
- 7.2 Automotive OEMs
- 7.3 Auto dealerships / dealer groups
- 7.4 Auto-tech startups & mobility companies
- 7.5 Car subscription software providers / platform providers
- 7.6 Leasing & financial services companies
Chapter 8 Market Estimates & Forecast, By End Use, 2021 - 2034 ($Mn)
- 8.1 Key trends
- 8.2 Enterprise users
- 8.3 Private users
Chapter 9 Market Estimates & Forecast, By Vehicle, 2021 - 2034 ($Mn)
- 9.1 Key trends
- 9.2 Passenger cars
- 9.2.1 Hatchback
- 9.2.2 Sedan
- 9.2.3 SUV
- 9.3 Commercial vehicles
- 9.3.1 LCV
- 9.3.2 MCV
- 9.3.3 HCV
- 9.4 Two-wheelers
- 9.5 Specialty & utility vehicles
Chapter 10 Market Estimates & Forecast, By Region, 2021 - 2034 ($Mn)
- 10.1 Key trends
- 10.2 North America
- 10.2.1 US
- 10.2.2 Canada
- 10.3 Europe
- 10.3.1 Germany
- 10.3.2 UK
- 10.3.3 France
- 10.3.4 Italy
- 10.3.5 Spain
- 10.3.6 Nordics
- 10.3.7 Russia
- 10.4 Asia Pacific
- 10.4.1 China
- 10.4.2 India
- 10.4.3 Japan
- 10.4.4 South Korea
- 10.4.5 ANZ
- 10.4.6 Vietnam
- 10.4.7 Indonesia
- 10.5 Latin America
- 10.5.1 Brazil
- 10.5.2 Mexico
- 10.5.3 Argentina
- 10.6 MEA
- 10.6.1 South Africa
- 10.6.2 Saudi Arabia
- 10.6.3 UAE
Chapter 11 Company Profiles
- 11.1 Global companies
- 11.1.1 ARI Fleet Management
- 11.1.2 BMW
- 11.1.3 Care by Volvo
- 11.1.4 Element Fleet Management
- 11.1.5 Hertz
- 11.1.6 Hyundai
- 11.1.7 LeasePlan/Ayvens
- 11.1.8 Mercedes-Benz
- 11.1.9 Penske Truck Leasing
- 11.1.10 Ryder System
- 11.1.11 Sixt
- 11.1.12 Turo
- 11.1.13 Volkswagen
- 11.1.14 Waymo
- 11.1.15 Wheels
- 11.1.16 Zipcar
- 11.2 Regional players
- 11.2.1 Emkay
- 11.2.2 Lime
- 11.2.3 Merchants Fleet
- 11.2.4 Mike Albert Fleet Solutions
- 11.2.5 PacLease
- 11.3 Emerging players
- 11.3.1 Finn Auto
- 11.3.2 Porsche Drive

