
PUBLISHER: Global Market Insights Inc. | PRODUCT CODE: 1685088

PUBLISHER: Global Market Insights Inc. | PRODUCT CODE: 1685088
Europe Oil Filled Distribution Transformer Market Opportunity, Growth Drivers, Industry Trend Analysis, and Forecast 2025 - 2034
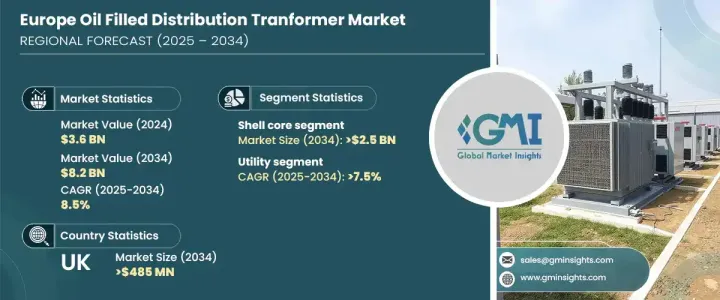
Europe Oil Filled Distribution Transformer Market was valued at USD 3.6 billion in 2024 and is projected to grow at a CAGR of 8.5% between 2025 and 2034. The market is experiencing substantial expansion as Europe accelerates its transition to greener energy systems. With the increasing adoption of renewable energy sources such as wind and solar, the need for a robust and efficient power distribution network has never been greater. Oil-filled transformers are at the core of this shift, offering superior reliability, efficiency, and the ability to handle high-capacity loads. These transformers play a crucial role in stabilizing energy grids, ensuring seamless power transmission as the region integrates more renewable sources. Governments across Europe are implementing stricter energy regulations and sustainability initiatives, further driving market growth.
The demand for oil-filled distribution transformers is also being propelled by technological advancements and the modernization of electrical grids. Smart grid initiatives, coupled with increasing investments in energy infrastructure, are pushing the development of transformers equipped with digital monitoring and predictive maintenance capabilities. These features enhance operational efficiency and longevity, aligning with Europe's focus on reducing environmental impact while improving energy security. Additionally, the ongoing expansion of electric vehicle charging infrastructure and the increasing electrification of various industries contribute to the rising demand for reliable transformers. With growing investments in power distribution networks, the market for oil-filled transformers is expected to experience sustained growth in the coming years.
| Market Scope | |
|---|---|
| Start Year | 2024 |
| Forecast Year | 2025-2034 |
| Start Value | $3.6 Billion |
| Forecast Value | $8.2 Billion |
| CAGR | 8.5% |
The shell core segment is poised to generate USD 2.5 billion by 2034, driven by its critical role in modernized grids. These transformers are evolving to meet the demands of advanced energy distribution systems, supporting high-efficiency power transmission with improved performance and durability. As energy sustainability becomes a top priority, shell core transformers are becoming integral components in smart grids and eco-conscious infrastructure. Cutting-edge features, including real-time performance tracking and fault detection, enhance their functionality, ensuring a stable and resilient power network. The growing shift towards high-performing, energy-efficient transformer designs is shaping the future of this segment, making it a crucial driver of overall market growth.
The utility sector remains a key player in the oil-filled distribution transformer market, with anticipated growth at 7.5% through 2034. Utilities across Europe are upgrading aging infrastructure to accommodate the rising share of renewable energy sources in the grid. As power loads become increasingly variable due to fluctuations in solar and wind energy generation, the need for reliable transformers that can manage these changes efficiently continues to grow. Oil-filled transformers play a vital role in ensuring grid stability, reducing transmission losses, and enhancing the overall efficiency of the power distribution system.
The UK oil-filled distribution transformer market is expected to generate USD 485 million by 2034, supported by stringent regulatory policies aimed at improving energy efficiency and reducing carbon emissions. The country's commitment to achieving net-zero emissions is pushing energy providers to invest in high-efficiency transformer technologies. Regulatory frameworks demand the adoption of transformers with lower energy losses and higher sustainability standards, prompting utilities and industries to replace outdated systems with advanced oil-filled transformers.
Table of Contents
Chapter 1 Methodology & Scope
- 1.1 Market definitions
- 1.2 Base estimates & calculations
- 1.3 Forecast calculation
- 1.4 Data sources
- 1.4.1 Primary
- 1.4.2 Secondary
- 1.4.2.1 Paid
- 1.4.2.2 Public
Chapter 2 Industry Insights
- 2.1 Industry ecosystem analysis
- 2.2 Regulatory landscape
- 2.3 Industry impact forces
- 2.3.1 Growth drivers
- 2.3.2 Industry pitfalls & challenges
- 2.4 Growth potential analysis
- 2.5 Porter's Analysis
- 2.5.1 Bargaining power of suppliers
- 2.5.2 Bargaining power of buyers
- 2.5.3 Threat of new entrants
- 2.5.4 Threat of substitutes
- 2.6 PESTEL Analysis
Chapter 3 Competitive landscape, 2024
- 3.1 Strategic dashboard
- 3.2 Innovation & sustainability landscape
Chapter 4 Market Size and Forecast, By Core, 2021 – 2034 (USD Million, ‘000 Units)
- 4.1 Key trends
- 4.2 Closed
- 4.3 Shell
- 4.4 Berry
Chapter 5 Market Size and Forecast, By Winding, 2021 – 2034 (USD Million, ‘000 Units)
- 5.1 Key trends
- 5.2 Two winding
- 5.3 Auto transformer
Chapter 6 Market Size and Forecast, By Rating, 2021 – 2034 (USD Million, ‘000 Units)
- 6.1 Key trends
- 6.2 ≤ 250 kVA
- 6.3 > 250 kVA to ≤ 1 MVA
- 6.4 > 1 MVA
Chapter 7 Market Size and Forecast, By Application, 2021 – 2034 (USD Million, ‘000 Units)
- 7.1 Key trends
- 7.2 Residential
- 7.3 Commercial & industrial
- 7.4 Utility
Chapter 8 Market Size and Forecast, By Country, 2021 – 2034 (USD Million, ‘000 Units)
- 8.1 Key trends
- 8.2 UK
- 8.3 Germany
- 8.4 France
- 8.5 Russia
- 8.6 Italy
Chapter 9 Company Profiles
- 9.1 Eaton
- 9.2 ERMCO
- 9.3 General Electric
- 9.4 Hitachi ABB Power Grids
- 9.5 Hyosung Heavy Industries
- 9.6 Schneider Electric
- 9.7 Siemens
- 9.8 Toshiba Corporation

