
PUBLISHER: Global Market Insights Inc. | PRODUCT CODE: 1750535

PUBLISHER: Global Market Insights Inc. | PRODUCT CODE: 1750535
Ceramic Tiles Market Opportunity, Growth Drivers, Industry Trend Analysis, and Forecast 2025 - 2034
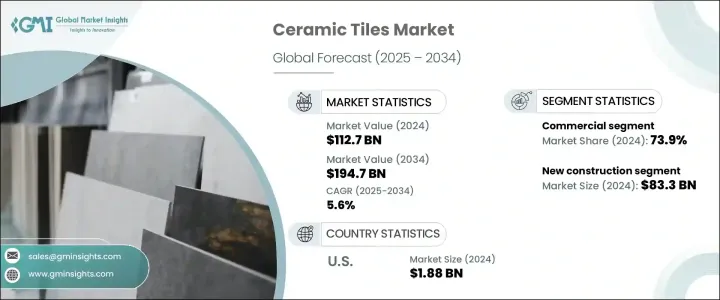
The Global Ceramic Tiles Market was valued at USD 112.7 billion in 2024 and is estimated to grow at a CAGR of 5.6% to reach USD 194.7 billion by 2034. Over the past few years, there has been a noticeable shift in consumer preferences toward flooring designs that enhance visual appeal more than traditional wall applications. This changing preference is largely influenced by a growing desire for sophisticated interiors, modern lifestyle trends, and the rapid development of urban areas. As individuals and businesses alike focus on creating aesthetically pleasing environments, the demand for ceramic tiles continues to rise. These tiles offer a wide array of designs, finishes, and color options, which provide ample room for personalization. This level of design flexibility empowers consumers to match tile selections with their unique stylistic requirements, leading to higher adoption across both residential and commercial applications.
A major factor contributing to this growth is the use of advanced digital printing technologies in tile production. This innovation enables manufacturers to create intricate and customizable patterns that appeal to the ever-evolving tastes of modern consumers. The integration of such technologies supports the creation of high-resolution textures and visual effects, which add value to the finished product. In turn, this keeps the ceramic tiles industry dynamic and relevant in the face of changing design trends. Alongside aesthetics, the tiles' compatibility with sustainable construction materials has also fueled market expansion. Many ceramic tiles are made from natural ingredients, which makes them an ideal fit for environmentally conscious building initiatives. Their durability, low maintenance needs, and energy efficiency further strengthen their appeal in the construction sector.
| Market Scope | |
|---|---|
| Start Year | 2024 |
| Forecast Year | 2025-2034 |
| Start Value | $112.7 Billion |
| Forecast Value | $194.7 Billion |
| CAGR | 5.6% |
Based on usage, the market is segmented into new construction and repairs & renovations. The new construction category emerged as the leading segment, generating USD 83.3 billion in revenue in 2024. It is anticipated to grow at a CAGR of 5.8% over the forecast period. This growth can be attributed to the increasing emphasis on green building practices and the rising demand for modern construction materials that align with sustainable architecture. Ceramic tiles offer an ideal solution by combining functionality with visual appeal, making them a top choice for architects and builders in new developments.
In terms of end-use, the global ceramic tiles market is divided into residential and commercial segments. The commercial sector dominated the industry, holding a market share of 73.9% in 2024. The growing need for durable and visually attractive surfaces in commercial buildings has been a major growth driver. From office buildings to retail spaces and public facilities, commercial projects demand flooring solutions that offer longevity, safety, and aesthetic value. Ceramic tiles meet these requirements while also offering design versatility and easy maintenance, making them a preferred option for large-scale infrastructure and real estate developments.
The increasing focus on eco-friendly infrastructure and smart building initiatives by local and regional governments is another factor propelling the demand for ceramic tiles in commercial spaces. Technological advancements such as anti-slip features and energy-efficient materials have enhanced the functionality of ceramic tiles, further expanding their market potential in public and institutional projects.
In the United States, the ceramic tiles market was valued at USD 1.88 billion in 2024 and is expected to experience strong growth throughout the forecast period. This momentum is driven by the robust expansion of the U.S. construction sector, which continues to invest heavily in both residential and commercial developments. As the need for stylish and long-lasting materials grows in line with construction activity, ceramic tiles remain a top contender due to their design flexibility and resilience. From residential homes to commercial properties, the demand for multifunctional surfaces continues to boost the ceramic tile market.
Prominent players contributing to the growth and innovation in this industry include China Ceramics Co., Ltd., Ceramiche Atlas Concorde S.p.A., Florida Tile, Inc., Crossville, Inc., GRUPO LAMOSA, Gruppo Ceramiche Ricchetti S.p.A., GRUPO PAMESA, KAJARIA CERAMICS, Porcelanosa Grupo, RAK CERAMICS, Mohawk Industries, Inc., Ras Al Khaimah Ceramics, Siam Cement Group, Solvay S.A., SCG CERAMICS, and VICTORIA PLC. These companies are continuously investing in product development, manufacturing efficiency, and market expansion to strengthen their presence in the global ceramic tiles market.
Table of Contents
Chapter 1 Methodology & Scope
- 1.1 Market scope & definitions
- 1.2 Base estimates & calculations
- 1.3 Forecast calculations
- 1.4 Data sources
- 1.4.1 Primary
- 1.4.2 Secondary
- 1.4.2.1 Paid sources
- 1.4.2.2 Public sources
Chapter 2 Executive Summary
- 2.1 Industry 3600 synopsis, 2021-2034
Chapter 3 Industry Insights
- 3.1 Industry ecosystem analysis
- 3.1.1 Factor affecting the value chain
- 3.1.2 Profit margin analysis
- 3.1.3 Disruptions
- 3.1.4 Future outlook
- 3.1.5 Manufacturers
- 3.1.6 Distributors
- 3.2 Impact of Trump administration tariffs
- 3.2.1 Trade impact
- 3.2.1.1 Trade volume disruptions
- 3.2.1.2 Retaliatory measures
- 3.2.2 Impact on industry
- 3.2.2.1 Supply-side impact (raw materials)
- 3.2.2.1.1 Price volatility in key materials
- 3.2.2.1.2 Supply chain restructuring
- 3.2.2.1.3 Production cost implications
- 3.2.2.2 Demand-side impact (Cost to customers)
- 3.2.2.2.1 Price transmission to end markets
- 3.2.2.2.2 Market share dynamics
- 3.2.2.2.3 Consumer response patterns
- 3.2.2.1 Supply-side impact (raw materials)
- 3.2.3 Key companies impacted
- 3.2.4 Strategic industry responses
- 3.2.4.1 Supply chain reconfiguration
- 3.2.4.2 Pricing and product strategies
- 3.2.4.3 Policy engagement
- 3.2.5 Outlook & future considerations
- 3.2.1 Trade impact
- 3.3 Supplier landscape
- 3.4 Profit margin analysis
- 3.5 Technological overview
- 3.6 Regulatory landscape
- 3.7 Impact forces
- 3.7.1 Growth drivers
- 3.7.1.1 Increasing demand for durable and stylish flooring solutions
- 3.7.1.2 Urbanization and Infrastructure Development
- 3.7.1.3 Renovation and Remodeling Trends
- 3.7.2 Industry pitfalls & challenges
- 3.7.2.1 Raw Material Costs and Availability
- 3.7.1 Growth drivers
- 3.8 Growth potential analysis
- 3.9 Porter's analysis
- 3.10 PESTEL analysis
Chapter 4 Competitive Landscape, 2024
- 4.1 Introduction
- 4.2 Company market share analysis
- 4.3 Competitive positioning matrix
- 4.4 Strategic outlook matrix
Chapter 5 Market Estimates & Forecast, By Usage, 2021-2034 (USD Billion) (Million Square Meters)
- 5.1 Key trends
- 5.2 Repairs & renovation
- 5.3 New construction
Chapter 6 Market Estimates & Forecast, By Product, 2021-2034 (USD Billion) (Million Square Meters)
- 6.1 Key trends
- 6.2 Floor tiles
- 6.3 Wall tiles
- 6.4 Others
Chapter 7 Market Estimates & Forecast, By End Use, 2021-2034 (USD Billion) (Million Square Meters)
- 7.1 Key trends
- 7.2 Residential
- 7.3 Commercial
Chapter 8 Market Estimates & Forecast, By Region, 2021-2034 (USD Billion) (Million Square Meters)
- 8.1 Key trends
- 8.2 North America
- 8.2.1 U.S.
- 8.2.2 Canada
- 8.3 Europe
- 8.3.1 UK
- 8.3.2 Germany
- 8.3.3 France
- 8.3.4 Italy
- 8.3.5 Spain
- 8.3.6 Russia
- 8.4 Asia Pacific
- 8.4.1 China
- 8.4.2 India
- 8.4.3 Japan
- 8.4.4 South Korea
- 8.4.5 Australia
- 8.4.6 Indonesia
- 8.4.7 Malaysia
- 8.5 Latin America
- 8.5.1 Brazil
- 8.5.2 Mexico
- 8.6 MEA
- 8.6.1 Saudi Arabia
- 8.6.2 South Africa
- 8.6.3 UAE
Chapter 9 Company Profiles
- 9.1 Ceramiche Atlas Concorde S.p.A.
- 9.2 China Ceramics Co., Ltd.
- 9.3 Crossville, Inc. ai Peroxide Company Limited
- 9.4 Florida Tile, Inc.
- 9.5 GRUPO LAMOSA
- 9.6 GRUPO PAMESA
- 9.7 Gruppo Ceramiche Ricchetti S.p.A.
- 9.8 KAJARIA CERAMICS
- 9.9 Mohawk Industries, Inc.
- 9.10 Porcelanosa Grupo
- 9.11 RAK CERAMICS
- 9.12 Ras Al Khaimah Ceramics
- 9.13 SCG CERAMICS
- 9.14 Siam Cement Group
- 9.15 Solvay S.A.
- 9.16 VICTORIA PLC

