
PUBLISHER: Global Market Insights Inc. | PRODUCT CODE: 1928953

PUBLISHER: Global Market Insights Inc. | PRODUCT CODE: 1928953
Trichlorosilane Market Opportunity, Growth Drivers, Industry Trend Analysis, and Forecast 2026 - 2035
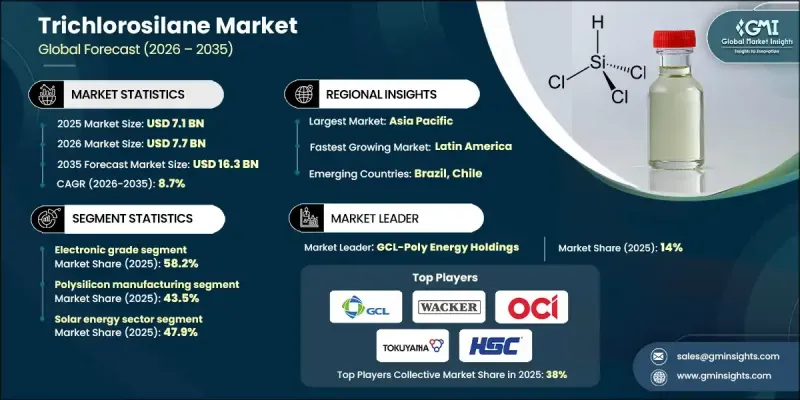
The Global Trichlorosilane Market was valued at USD 7.1 billion in 2025 and is estimated to grow at a CAGR of 8.7% to reach USD 16.3 billion by 2035.
Market expansion is driven by the increasing reliance on high-purity silicon for electronics, solar energy, and green hydrogen technologies. The global push toward carbon neutrality and clean energy has accelerated solar PV adoption, particularly in Asia-Pacific region, where supportive government policies in major economies have incentivized local solar manufacturing. The semiconductor sector is also contributing significantly to demand, with emerging technologies like artificial intelligence, electric vehicles, 5G, and Internet of Things devices requiring ultra-high-purity polysilicon derived from TCS. Companies are responding with investments in advanced purification processes and expanded production capacities to meet rising demand. Additionally, environmental regulations and the need to lower production costs are prompting a shift toward energy-efficient processes such as Fluidized Bed Reactor (FBR) technology, which reduces energy consumption by up to 80% compared to conventional methods.
| Market Scope | |
|---|---|
| Start Year | 2025 |
| Forecast Year | 2026-2035 |
| Start Value | $7.1 Billion |
| Forecast Value | $16.3 Billion |
| CAGR | 8.7% |
The electronic-grade TCS segment held 58.2% share in 2025 and is expected to grow at a CAGR of 8.9% through 2035. The segment's leadership stems from its critical role in producing ultra-pure polysilicon for semiconductors, solar PV cells, and fiber optics. Demand for 99.9999%+ purity TCS is rising due to the requirement for defect-free wafer and chip production in advanced electronics. Lower-grade alternatives fail to meet the stringent purity needed for high-performance semiconductor applications.
The solar energy sector accounted for 47.9% share in 2025 and is projected to grow at a CAGR of 8.6% through 2035. TCS serves as a primary feedstock for solar-grade polysilicon, essential for crystalline silicon PV cells. Global efforts toward decarbonization and clean energy adoption, particularly in nations aiming to expand solar PV capacity, continue to drive market growth.
North America Trichlorosilane Market held 25.9% in 2025. Growth in the region is supported by government initiatives designed to rebuild domestic semiconductor and solar manufacturing ecosystems, spurring higher production and consumption of TCS.
Leading players in the Global Trichlorosilane Market include American Elements, Evonik Industries, Tokuyama Corporation, OCI Company Ltd., REC Silicon, Wacker Chemie, Shin-Etsu Chemical, Linde, Gelest, GCL-Poly Energy Holdings, Haihang Group, Hemlock Semiconductor Operations, Hubei Jianghan New Materials, Iota Corporation, and Siad. Companies in the Global Trichlorosilane Market are pursuing several strategies to strengthen their foothold. Investments in advanced purification and production technologies enhance product quality and capacity. Strategic partnerships and joint ventures expand market access and secure supply chains for high-purity silicon. Firms are also focusing on sustainability by adopting energy-efficient manufacturing methods to meet environmental regulations. Expanding into emerging regions with high solar and semiconductor growth helps capture new customer bases.
Table of Contents
Chapter 1 Methodology & Scope
- 1.1 Market scope and definition
- 1.2 Research design
- 1.2.1 Research approach
- 1.2.2 Data collection methods
- 1.3 Data mining sources
- 1.3.1 Global
- 1.3.2 Regional/Country
- 1.4 Base estimates and calculations
- 1.4.1 Base year calculation
- 1.4.2 Key trends for market estimation
- 1.5 Primary research and validation
- 1.5.1 Primary sources
- 1.6 Forecast model
- 1.7 Research assumptions and limitations
Chapter 2 Executive Summary
- 2.1 Industry 360° synopsis
- 2.2 Key market trends
- 2.2.1 Regional
- 2.2.2 Grade
- 2.2.3 Application
- 2.2.4 End use
- 2.3 TAM Analysis, 2026-2035
- 2.4 CXO perspectives: Strategic imperatives
- 2.4.1 Executive decision points
- 2.4.2 Critical success factors
- 2.5 Future Outlook and Strategic Recommendations
Chapter 3 Industry Insights
- 3.1 Industry ecosystem analysis
- 3.1.1 Supplier landscape
- 3.1.2 Profit margin
- 3.1.3 Value addition at each stage
- 3.1.4 Factor affecting the value chain
- 3.1.5 Disruptions
- 3.2 Industry impact forces
- 3.2.1 Growth drivers
- 3.2.2 Industry pitfalls and challenges
- 3.2.3 Market opportunities
- 3.3 Growth potential analysis
- 3.4 Regulatory landscape
- 3.4.1 North America
- 3.4.2 Europe
- 3.4.3 Asia Pacific
- 3.4.4 Latin America
- 3.4.5 Middle East & Africa
- 3.5 Porter';s analysis
- 3.6 PESTEL analysis
- 3.7 Price trends
- 3.7.1 By region
- 3.7.2 By grade
- 3.8 Future market trends
- 3.9 Technology and Innovation landscape
- 3.9.1 Current technological trends
- 3.9.2 Emerging technologies
- 3.10 Patent Landscape
- 3.11 Trade statistics (HS code)
( Note: the trade statistics will be provided for key countries only)
- 3.11.1 Major importing countries
- 3.11.2 Major exporting countries
- 3.12 Sustainability and environmental aspects
- 3.12.1 Sustainable practices
- 3.12.2 Waste reduction strategies
- 3.12.3 Energy efficiency in production
- 3.12.4 Eco-friendly initiatives
- 3.13 Carbon footprint consideration
Chapter 4 Competitive Landscape, 2025
- 4.1 Introduction
- 4.2 Company market share analysis
- 4.2.1 By region
- 4.2.1.1 North America
- 4.2.1.2 Europe
- 4.2.1.3 Asia Pacific
- 4.2.1.4 LATAM
- 4.2.1.5 MEA
- 4.2.1 By region
- 4.3 Company matrix analysis
- 4.4 Competitive analysis of major market players
- 4.5 Competitive positioning matrix
- 4.6 Key developments
- 4.6.1 Mergers & acquisitions
- 4.6.2 Partnerships & collaborations
- 4.6.3 New Product Launches
- 4.6.4 Expansion Plans
Chapter 5 Market Estimates and Forecast, By Grade, 2022-2035 (USD Billion) (Kilo Tons)
- 5.1 Key trends
- 5.2 Electronic Grade
- 5.3 Industrial Grade
Chapter 6 Market Estimates and Forecast, By Application, 2022-2035 (USD Billion) (Kilo Tons)
- 6.1 Key trends
- 6.2 Polysilicon Manufacturing
- 6.3 Silane Gas Production
- 6.4 Silicone Intermediate
- 6.5 Photovoltaic Cells
- 6.6 Optical Fibers
- 6.7 Coatings and Adhesives
- 6.8 Laboratory Reagents
- 6.9 Semiconductor Components
Chapter 7 Market Estimates and Forecast, By End Use, 2022-2035 (USD Billion) (Kilo Tons)
- 7.1 Key trends
- 7.2 Solar Energy Sector
- 7.2.1 Photovoltaic cell production
- 7.2.2 Solar panel manufacturing
- 7.3 Semiconductor & Electronics
- 7.3.1 IC manufacturing
- 7.3.2 Wafer and chip fabrication
- 7.3.3 MEMS sensors
- 7.3.4 LED & photodetector fabrication
- 7.4 Chemical Processing
- 7.4.1 Silane and silicone production
- 7.4.2 Specialty chemical intermediates
- 7.5 Telecommunications
- 7.5.1 Optical fiber cables and components
- 7.5.2 Glass preform production
- 7.6 Automotive & Mobility
- 7.6.1 Silicon chips for ADAS and EVs
- 7.6.2 Coatings and sensors using silicon tech
- 7.7 Aerospace & Defense
- 7.7.1 High-temperature resistant silicone parts
- 7.7.2 Electronic shielding components
- 7.8 Construction & Infrastructure
- 7.8.1 Weather-resistant sealants
- 7.8.2 Coatings & adhesives
- 7.9 Healthcare & Medical Devices
- 7.9.1 Medical-grade silicones and implants
- 7.9.2 Diagnostic sensor components
Chapter 8 Market Estimates and Forecast, By Region, 2022-2035 (USD Billion) (Kilo Tons)
- 8.1 Key trends
- 8.2 North America
- 8.2.1 U.S.
- 8.2.2 Canada
- 8.3 Europe
- 8.3.1 Germany
- 8.3.2 UK
- 8.3.3 France
- 8.3.4 Spain
- 8.3.5 Italy
- 8.3.6 Rest of Europe
- 8.4 Asia Pacific
- 8.4.1 China
- 8.4.2 India
- 8.4.3 Japan
- 8.4.4 Australia
- 8.4.5 South Korea
- 8.4.6 Rest of Asia Pacific
- 8.5 Latin America
- 8.5.1 Brazil
- 8.5.2 Mexico
- 8.5.3 Argentina
- 8.5.4 Rest of Latin America
- 8.6 Middle East and Africa
- 8.6.1 Saudi Arabia
- 8.6.2 South Africa
- 8.6.3 UAE
- 8.6.4 Rest of Middle East and Africa
Chapter 9 Company Profiles
- 9.1 American Elements
- 9.2 Evonik Industries
- 9.3 GCL-Poly Energy Holdings
- 9.4 Gelest
- 9.5 Haihang Group
- 9.6 Hemlock Semiconductor Operations
- 9.7 Hubei Jianghan New Materials
- 9.8 Iota Corporation
- 9.9 Linde
- 9.10 OCI Company Ltd.
- 9.11 REC Silicon
- 9.12 Shin-Etsu Chemical
- 9.13 Siad
- 9.14 Tokuyama Corporation
- 9.15 Wacker Chemie
- 9.16 Others

