
PUBLISHER: Global Market Insights Inc. | PRODUCT CODE: 2045765

PUBLISHER: Global Market Insights Inc. | PRODUCT CODE: 2045765
North America Blue Hydrogen Market Opportunity, Growth Drivers, Industry Trend Analysis, and Forecast 2026 - 2035
North America Blue Hydrogen Market was valued at USD 1.31 billion in 2025 and is estimated to grow at a CAGR of 2.9% to reach USD 1.73 billion by 2035.
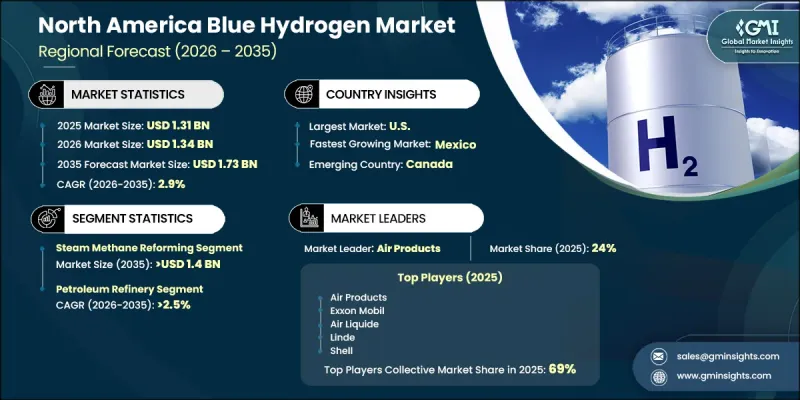
Market expansion is driven by the increasing shift toward low-carbon hydrogen production supported by carbon capture integration. Blue hydrogen is produced through steam methane reforming, where natural gas serves as the primary feedstock, combined with carbon capture and storage systems that capture carbon dioxide generated during production to prevent atmospheric release. Rising decarbonization targets across power generation, transportation, and industrial manufacturing sectors are significantly strengthening market demand. Supportive policy frameworks, government incentives, and emissions reduction mandates are encouraging investments in cleaner hydrogen technologies across the region. Abundant natural gas availability and increasing corporate commitments to net-zero goals are further reinforcing the adoption of low-emission hydrogen solutions. Continuous improvements in carbon capture and storage technologies are enhancing project scalability and economic feasibility, making blue hydrogen more commercially viable. In addition, increasing collaboration between energy companies, technology providers, and research institutions through joint ventures and public-private partnerships is accelerating innovation and deployment across the market. Growing consumer preference for clean energy solutions and long-term sustainability commitments are also contributing to market momentum across North America.
| Market Scope | |
|---|---|
| Start Year | 2025 |
| Forecast Year | 2026-2035 |
| Start Value | $1.31 Billion |
| Forecast Value | $1.73 Billion |
| CAGR | 2.9% |
Steam methane reforming is expected to reach USD 1.4 billion by 2035, driven by its cost efficiency, scalability, and suitability for large-scale hydrogen production. Its maturity as a widely established technology, combined with compatibility with existing infrastructure and operational expertise, continues to support strong adoption across industrial applications.
The chemical blue hydrogen segment is projected to generate USD 400 million by 2035, supported by its role as a direct replacement for conventional hydrogen in ammonia, methanol, and fertilizer production. Increasing pressure to reduce carbon emissions across chemical manufacturing and petrochemical value chains is driving demand for cleaner hydrogen alternatives. Large-scale industrial hubs, particularly along major chemical production corridors, are benefiting from integrated hydrogen pipelines and carbon capture systems that improve operational efficiency and economic viability.
U.S. Blue Hydrogen Market is expected to capture USD 1.25 billion by 2035, supported by the alignment of industrial investment strategies with decarbonization objectives. Major energy corporations, technology developers, and institutional investors are increasingly coordinating efforts to support emission reduction goals, reinforcing the strategic importance of blue hydrogen in energy transition pathways. Rising private sector investments are accelerating technological innovation and market expansion. In addition, supportive regulatory frameworks and state-level policies promoting low-carbon fuels are further strengthening market development across the country.
Key companies operating in the North America Blue Hydrogen Industry include Air Liquide, Linde, Shell, Exxon Mobil Corporation, BP p.l.c., Equinor ASA, Eni SpA, Baker Hughes, Bechtel Corporation, Fluor Corporation, Air Products, Johnson Matthey, Honeywell UOP, Carbon Clean, MaireTecnimont SpA, Saipem, Technip Energies, TOPSOE, thyssenkrupp Industrial Solutions AG, and ABB. Companies operating in the North America blue hydrogen market are adopting several strategic approaches to strengthen their market position and expand long-term competitiveness. Leading players are heavily investing in carbon capture and storage integration to improve emission reduction efficiency and enhance project viability. Many companies are forming strategic alliances, joint ventures, and public-private partnerships to accelerate technology development and infrastructure deployment. Expansion of hydrogen production facilities near natural gas reserves and industrial hubs is also being prioritized to reduce transportation costs and improve supply chain efficiency. Firms are increasing research and development efforts to improve steam methane reforming efficiency and enhance carbon capture performance.
Table of Contents
Chapter 1 Methodology & Scope
- 1.1 Research design
- 1.2 Quality commitment
- 1.2.1 GMI AI policy & data integrity commitment
- 1.2.1.1 Source consistency protocol
- 1.2.1 GMI AI policy & data integrity commitment
- 1.3 Research trail & confidence scoring
- 1.3.1 Research trail components
- 1.3.2 Scoring components
- 1.4 Data collection
- 1.4.1 Partial list of primary sources
- 1.5 Data mining sources
- 1.5.1 Paid sources
- 1.5.1.1 Sources, by region
- 1.5.1 Paid sources
- 1.6 Base estimates and calculations
- 1.6.1 Base year calculation for any one approach
- 1.7 Forecast model
- 1.8 Research transparency addendum
- 1.8.1 Source attribution framework
- 1.8.2 Quality assurance metrics
- 1.8.3 Our commitment to trust
- 1.9 Market definitions
Chapter 2 Executive Summary
- 2.1 Industry synopsis, 2022 - 2035
- 2.2 Business trends
- 2.3 Application trends
- 2.4 Technology trends
- 2.5 Country trends
Chapter 3 Industry Insights
- 3.1 Industry ecosystem
- 3.1.1 Raw material availability & sourcing analysis
- 3.1.2 Supply chain resilience & risk factors
- 3.1.3 Distribution network analysis
- 3.2 Regulatory landscape
- 3.3 Industry impact forces
- 3.3.1 Growth drivers
- 3.3.2 Industry pitfalls & challenges
- 3.4 Growth potential analysis
- 3.5 Porter's analysis
- 3.5.1 Bargaining power of suppliers
- 3.5.2 Bargaining power of buyers
- 3.5.3 Threat of new entrants
- 3.5.4 Threat of substitutes
- 3.6 PESTEL analysis
- 3.6.1 Political factors
- 3.6.2 Economic factors
- 3.6.3 Social factors
- 3.6.4 Technological factors
- 3.6.5 Legal factors
- 3.6.6 Environmental factors
- 3.7 Cost structure analysis
- 3.8 Price trend analysis, 2022-2035 (USD/MT)
- 3.8.1 By Technology
- 3.8.2 By Country
- 3.9 Emerging opportunities & trends
- 3.9.1 Digitalization & IoT integration
- 3.10 Investment analysis & future outlook
Chapter 4 Competitive landscape, 2026
- 4.1 Introduction
- 4.2 Company market share analysis, by country, 2025
- 4.2.1 U.S.
- 4.2.2 Canada
- 4.2.3 Mexico
- 4.3 Competitive positioning matrix
- 4.4 Key developments
- 4.4.1 Mergers & acquisitions
- 4.4.2 Partnerships & collaborations
- 4.4.3 New product launches
- 4.4.4 Expansion plans & funding
Chapter 5 Market Size and Forecast, By Application, 2022 - 2035 (USD Billion & MT)
- 5.1 Key trends
- 5.2 Petroleum Refinery
- 5.3 Chemical
- 5.4 Others
Chapter 6 Market Size and Forecast, By Technology, 2022 - 2035 (USD Billion & MT)
- 6.1 Key trends
- 6.2 Steam Methane Reforming
- 6.3 Auto Thermal Reforming
- 6.4 Partial Oxidation
Chapter 7 Market Size and Forecast, By Country, 2022 - 2035 (USD Billion & MT)
- 7.1 Key trends
- 7.2 U.S.
- 7.3 Canada
- 7.4 Mexico
Chapter 8 Company Profiles
- 8.1 ABB Ltd.
- 8.2 Air Liquide
- 8.3 Air Products Inc.
- 8.4 Baker Hughes
- 8.5 Bechtel Corporation
- 8.6 BP p.l.c.
- 8.7 Carbon Clean
- 8.8 Eni SpA
- 8.9 Equinor ASA
- 8.10 Exxon Mobil Corporation
- 8.11 Fluor Corporation
- 8.12 Honeywell UOP
- 8.13 Johnson Matthey
- 8.14 Linde plc
- 8.15 MaireTecnimont SpA
- 8.16 Saipem
- 8.17 Shell Plc
- 8.18 Technip Energies N.V.
- 8.19 thyssenkrupp Industrial Solutions AG
- 8.20 TOPSOE

