
PUBLISHER: Global Market Insights Inc. | PRODUCT CODE: 2061456

PUBLISHER: Global Market Insights Inc. | PRODUCT CODE: 2061456
Blue Hydrogen Market Opportunity, Growth Drivers, Industry Trend Analysis, and Forecast 2026 - 2035
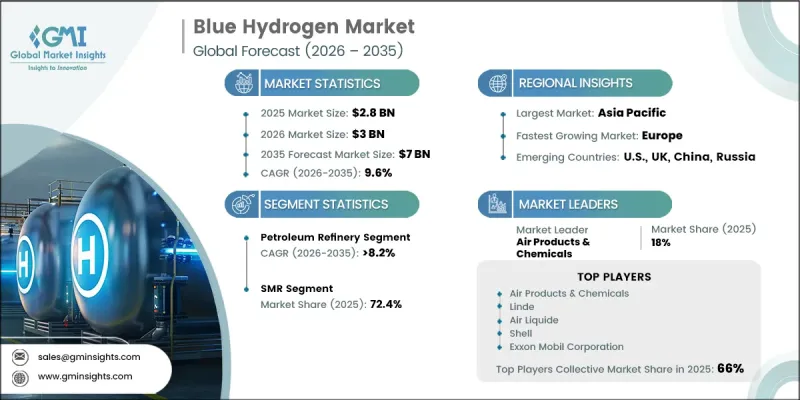
The Global Blue Hydrogen Market was valued at USD 2.8 billion in 2025 and is estimated to grow at a CAGR of 9.6% to reach USD 7 billion by 2035.
Growing emphasis on energy security and diversification of hydrogen supply sources is expected to support strong expansion of the blue hydrogen industry over the coming years. Blue hydrogen production enables large-scale hydrogen generation with comparatively lower carbon emissions while utilizing natural gas as a feedstock. Rising investments in low-carbon hydrogen infrastructure by major corporations are further accelerating market development. Increasing global demand for cleaner energy alternatives and the growing adoption of industrial decarbonization strategies are also contributing to higher utilization of blue hydrogen across multiple sectors. The integration of carbon capture and storage technologies within blue hydrogen production processes is helping industries align with carbon reduction targets and sustainability objectives. Long-term industry growth is expected to be supported by scalable infrastructure development and continuous advancements in carbon abatement technologies. In addition, supportive government policies promoting clean energy transition, combined with the availability of natural gas resources, are encouraging wider technology adoption. The ability to leverage existing energy infrastructure for low-carbon hydrogen production is creating an economically viable pathway for reducing emissions across hard-to-abate industrial sectors.
| Market Scope | |
|---|---|
| Start Year | 2025 |
| Forecast Year | 2026-2035 |
| Start Value | $2.8 Billion |
| Forecast Value | $7 Billion |
| CAGR | 9.6% |
The petroleum refinery segment is projected to witness growth at a CAGR of 8.2% through 2035 due to increasing demand for low-carbon hydrogen solutions within refining operations. Refineries are steadily transitioning toward cleaner fuel alternatives to support decarbonization objectives and comply with tightening environmental regulations. Rising focus on reducing industrial emissions and improving sustainability across refining activities is expected to strengthen demand for blue hydrogen technologies in the coming years.
The steam methane reforming segment accounted for 72.4% share in 2025. The segment continues to dominate the industry due to its established infrastructure, cost-efficient production capabilities, and high hydrogen yield efficiency. Increasing investments in carbon capture and storage systems integrated with steam methane reforming facilities are expected to further accelerate segment growth. In addition, the widespread application of blue hydrogen across refining and chemical manufacturing industries is supporting higher adoption of steam methane reforming technologies worldwide.
U.S. Blue Hydrogen Market is anticipated to reach USD 1.26 billion by 2035. North America accounted for approximately 46.9% of the global blue hydrogen market share in 2025, supported by growing investments in low-carbon hydrogen infrastructure and strategic industry collaborations. Expanding hydrogen-ammonia trade routes and increasing focus on clean energy partnerships are expected to contribute significantly to market growth across the region. Rising demand for decarbonization technologies and strong policy support for carbon reduction initiatives are also strengthening the industry outlook in North America.
Major companies operating in the Global Blue Hydrogen Market include Air Products and Chemicals, Air Liquide, Aker Solutions, Bechtel Corporation, BP, CF Industries, Eni, Exxon Mobil Corporation, Equinor, John Wood Group, Johnson Matthey, Linde, MaireTecnimont, Saipem, SK E&S, Shell, Saudi Aramco, Technip Energies, Topsoe, thyssenkrupp Industrial Solutions, Uniper, and Woodside. Companies operating in the blue hydrogen market are adopting multiple strategic initiatives to strengthen their market presence and improve long-term competitiveness. Industry participants are investing heavily in carbon capture and storage technologies to enhance low-carbon hydrogen production efficiency and meet global emission reduction targets. Many companies are also forming strategic partnerships and joint ventures to accelerate infrastructure development and expand hydrogen supply networks. Investments in large-scale production facilities, hydrogen transportation systems, and export infrastructure are helping businesses improve supply chain capabilities and market reach. In addition, organizations are focusing on integrating advanced technologies with existing natural gas infrastructure to reduce operational costs and support scalable hydrogen deployment.
Table of Contents
Chapter 1 Methodology & Scope
- 1.1 Research design
- 1.2 Quality commitment
- 1.2.1 GMI AI policy & data integrity commitment
- 1.2.1.1 Source consistency protocol
- 1.2.1 GMI AI policy & data integrity commitment
- 1.3 Research trail & confidence scoring
- 1.3.1 Research trail components
- 1.3.2 Scoring components
- 1.4 Data collection
- 1.4.1 Partial list of primary sources
- 1.5 Data mining sources
- 1.5.1 Paid sources
- 1.5.1.1 Sources, by region
- 1.5.1 Paid sources
- 1.6 Base estimates and calculations
- 1.6.1 Base year calculation for any one approach
- 1.7 Forecast model
- 1.8 Research transparency addendum
- 1.8.1 Source attribution framework
- 1.8.2 Quality assurance metrics
- 1.8.3 Our commitment to trust
- 1.9 Market definitions
Chapter 2 Executive Summary
- 2.1 Industry synopsis, 2022 - 2035
- 2.2 Business trends
- 2.3 Technology trends
- 2.4 Application trends
- 2.5 Transportation mode trends
- 2.6 Regional trends
Chapter 3 Industry Insights
- 3.1 Industry ecosystem
- 3.1.1 Natural gas supply chain
- 3.1.2 Blue hydrogen production infrastructure
- 3.1.3 CCUS infrastructure integration
- 3.1.4 Distribution & transportation networks
- 3.1.5 End-user integration points
- 3.2 Regulatory landscape
- 3.2.1 Carbon pricing mechanisms & emissions trading systems
- 3.2.2 Clean hydrogen standards & certification schemes
- 3.2.3 CCUS regulations & monitoring requirements
- 3.2.4 Transportation & safety regulations
- 3.3 Industry impact forces
- 3.3.1 Growth drivers
- 3.3.2 Industry pitfalls & challenges
- 3.4 Growth potential analysis
- 3.5 Porter's analysis
- 3.5.1 Bargaining power of suppliers
- 3.5.2 Bargaining power of buyers
- 3.5.3 Threat of new entrants
- 3.5.4 Threat of substitutes
- 3.6 PESTEL analysis
- 3.6.1 Political factors
- 3.6.2 Economic factors
- 3.6.3 Social factors
- 3.6.4 Technological factors
- 3.6.5 Legal factors
- 3.6.6 Environmental factors
- 3.7 Cost structure analysis
- 3.8 Price trend analysis, 2022-2035 (USD/MW) (Driven by Primary Research)
- 3.8.1 Historical price trend analysis
- 3.8.2 Pricing strategy by player type
- 3.9 Trade Data Analysis (Driven by Primary Research)
- 3.9.1 Import/export volume & value trends
- 3.9.2 Key trade corridors & tariff impact
- 3.9.3 Cross-border pipeline infrastructure
- 3.10 Capacity & Production Landscape (Driven by Primary Research)
- 3.10.1 Installed capacity by region & key producer
- 3.10.2 Capacity utilization rates & expansion pipelines
- 3.11 Emerging opportunities & trends
- 3.11.1 Digitalization & IoT integration
- 3.11.2 Investment analysis & future outlook
- 3.12 Impact of AI & Generative AI on the Market
- 3.12.1 AI-Driven disruption of existing business models
- 3.12.2 GenAI use cases & adoption roadmap by segment
- 3.12.3 Risks, limitations & regulatory considerations
Chapter 4 Competitive landscape, 2026
- 4.1 Introduction
- 4.2 Company market share, by region, 2025
- 4.2.1 North America
- 4.2.2 Europe
- 4.2.3 Asia Pacific
- 4.2.4 Middle East & Africa
- 4.2.5 Latin America
- 4.3 Competitive positioning matrix
- 4.4 Key developments
- 4.4.1 Mergers & acquisitions
- 4.4.2 Partnerships & collaborations
- 4.4.3 New product launches
- 4.4.4 Expansion plans & funding
- 4.5 Company tier benchmarking
- 4.5.1 Tier classification criteria & qualifying thresholds
- 4.5.2 Tier positioning matrix by revenue, geography & innovation
Chapter 5 Market Size and Forecast, By Application, 2022 - 2035 (USD Billion & MT)
- 5.1 Key trends
- 5.2 Petroleum refinery
- 5.3 Chemical
- 5.4 Others
Chapter 6 Market Size and Forecast, By Technology, 2022 - 2035 (USD Billion & MT)
- 6.1 Key trends
- 6.2 Steam methane reforming
- 6.3 Auto thermal reforming
- 6.4 Partial oxidation
Chapter 7 Market Size and Forecast, By Transportation mode, 2022 - 2035 (USD Billion & MT)
- 7.1 Key trends
- 7.2 Pipelines
- 7.3 Cryogenic liquid tankers
Chapter 8 Market Size and Forecast, By Region, 2022 - 2035 (USD Billion & MT)
- 8.1 Key trends
- 8.2 North America
- 8.2.1 U.S.
- 8.2.2 Canada
- 8.2.3 Mexico
- 8.3 Europe
- 8.3.1 Germany
- 8.3.2 France
- 8.3.3 UK
- 8.3.4 Italy
- 8.3.5 Russia
- 8.4 Asia Pacific
- 8.4.1 China
- 8.4.2 India
- 8.4.3 Japan
- 8.4.4 Australia
- 8.5 Middle East & Africa
- 8.5.1 Saudi Arabia
- 8.5.2 Oman
- 8.5.3 UAE
- 8.5.4 Kuwait
- 8.5.5 Qatar
- 8.5.6 South Africa
- 8.6 Latin America
Chapter 9 Company Profiles
- 9.1 Air Products and Chemicals, Inc.
- 9.2 Air Liquide
- 9.3 Aker Solutions
- 9.4 Bechtel Corporation
- 9.5 BP
- 9.6 CF Industries
- 9.7 Eni
- 9.8 Exxon Mobil Corporation
- 9.9 Equinor
- 9.10 John Wood Group
- 9.11 Johnson Matthey
- 9.12 Linde
- 9.13 MaireTecnimont
- 9.14 Saipem
- 9.15 SK E&S
- 9.16 Shell
- 9.17 Saudi Aramco
- 9.18 Technip Energies
- 9.19 Topsoe
- 9.20 thyssenkrupp Industrial Solutions
- 9.21 Uniper
- 9.22 Woodside

