
PUBLISHER: Mordor Intelligence | PRODUCT CODE: 1934581

PUBLISHER: Mordor Intelligence | PRODUCT CODE: 1934581
United States Oil And Gas - Market Share Analysis, Industry Trends & Statistics, Growth Forecasts (2026 - 2031)
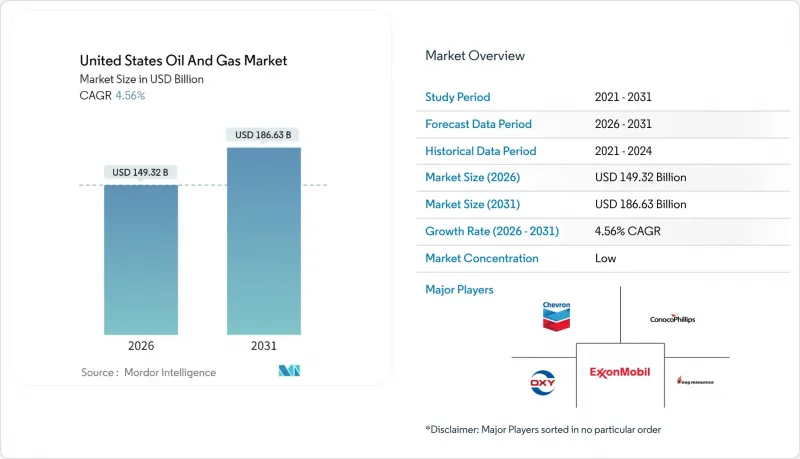
The United States Oil And Gas Market size in 2026 is estimated at USD 149.32 billion, growing from 2025 value of USD 142.81 billion with 2031 projections showing USD 186.63 billion, growing at 4.56% CAGR over 2026-2031.
Robust drilling productivity in tight-oil plays, the rapid build-out of Gulf Coast LNG trains, and steady technology diffusion into mature basins underpin this expansion. Structural change is evident as export-oriented growth outpaces domestic demand, with 15 billion cubic feet per day of new LNG liquefaction slated by 2028. Upstream reinvestment remains disciplined, yet efficiency gains allow production to rise even as rig counts fall. Meanwhile, mega-mergers concentrate Permian Basin acreage, unlocking shared infrastructure savings that strengthen breakeven resilience.
United States Oil And Gas Market Trends and Insights
Tight-oil Productivity Gains in the Permian
Advanced completion designs and AI-guided drilling lifted Permian Basin output to 6.3 million barrels per day in 2024, representing 60% of total US growth despite a leaner rig fleet. Longer laterals, higher proppant loading, and real-time frac optimization push recovery per well higher while trimming costs. ExxonMobil's integration of Pioneer aims for a further 15% uplift through standardized execution and shared infrastructure. Independent drillers mirror these tactics to remain competitive. Efficiency, therefore, anchors continued output gains that fortify the US oil and gas market against price swings
Surging LNG Export Capacity
New Gulf Coast liquefaction trains reshape demand by linking domestic supply to global price premia. Venture Global's Plaquemines terminal added 20 million tpa capacity in 2024, with Golden Pass to follow at 15.6 million tpa. The export surge boosts Appalachian and Haynesville drilling, while USD 15 billion of new pipelines funnel volumes south. Closer alignment with world markets tempers seasonal Henry Hub volatility, strengthening forward visibility for producers and midstream players, and reinforcing expansion in the US oil and gas market.
Methane-fee Compliance Costs Under EPA OOOOb/c
Beginning in 2024, methane emissions exceeding set thresholds incur fees starting at USD 900 per metric ton and rising to USD 1,500 by 2026. Added monitoring and repair programs raise operating costs by USD 2-4 per barrel for typical shale wells, hitting smaller producers hardest. Compliance demands speed consolidation and quick adoption of technology, such as continuous leak detection, to alter cost structures within the US oil and gas market.
Other drivers and restraints analyzed in the detailed report include:
- AI-driven Seismic Analytics for Marginal Well Recovery
- IRA 45Q & 45V Tax Credits Lowering CCS Costs
- Water-stress Limits on Permian Fracturing
For complete list of drivers and restraints, kindly check the Table Of Contents.
Segment Analysis
Upstream claimed 71.85% of the US oil and gas market size in 2025 and is on track for a 4.84% CAGR to 2031. Midstream captured 18.40%, buoyed by pipeline additions and LNG terminal build-outs, while downstream refining held 9.75% amid capacity limits and tighter emissions rules. Operators now target internal rates above 15% at USD 60 oil, steering capital toward high-return shale laterals and select long-cycle projects. ConocoPhillips' Willow development illustrates the shift, with 30-year reserves offering cash-flow depth rare in short-cycle shale projects. Drilling efficiency and disciplined reinvestment keep the upstream segment at the center of continued gains in the US oil and gas market.
Upstream's dominance rests on rapid productivity gains that hold costs near sub-USD 40 per barrel breakevens. Midstream remains an opportunity-rich sector as LNG growth drives storage and takeaway needs, yet capital discipline tempers speculative projects. Downstream margins are tightening amid competition from renewable diesel and the cost of regulatory upgrades. Together, these dynamics reinforce the upstream sector's outsized influence on revenue trends within the US oil and gas market.
The United States Oil and Gas Market Report is Segmented by Sector (Upstream, Midstream, and Downstream), Location (Onshore and Offshore), and Service (Construction, Maintenance and Turn-Around, and Decommissioning). The Market Sizes and Forecasts are Provided in Terms of Value (USD).
List of Companies Covered in this Report:
- Exxon Mobil Corp.
- Chevron Corp.
- ConocoPhillips Co.
- EOG Resources Inc.
- Occidental Petroleum Corp.
- Pioneer Natural Resources Co.
- Phillips 66 Co.
- Valero Energy Corp.
- Marathon Petroleum Corp.
- Hess Corp.
- Devon Energy Corp.
- BP PLC
- Shell PLC
Additional Benefits:
- The market estimate (ME) sheet in Excel format
- 3 months of analyst support
TABLE OF CONTENTS
1 Introduction
- 1.1 Study Assumptions & Market Definition
- 1.2 Scope of the Study
2 Research Methodology
3 Executive Summary
4 Market Landscape
- 4.1 Market Overview
- 4.2 Market Drivers
- 4.2.1 Tight-oil productivity gains in the Permian
- 4.2.2 Surging LNG export capacity -(new Gulf Coast trains)
- 4.2.3 AI-driven seismic analytics for marginal well recovery
- 4.2.4 IRA 45Q & 45V tax credits lowering CCS costs
- 4.2.5 Corporate green-bond funding for midstream build-out
- 4.2.6 Niche petro-feedstock demand from advanced plastics
- 4.3 Market Restraints
- 4.3.1 Methane-fee compliance costs under EPA OOOOb/c
- 4.3.2 Growing state-level setback rules (e.g., CO, NM)
- 4.3.3 Water-stress limits on Permian fracturing
- 4.3.4 Persistent WTI-Brent discount hurting exports
- 4.4 Supply-Chain Analysis
- 4.5 Regulatory Landscape
- 4.6 Technological Outlook
- 4.7 Crude-Oil Production & Consumption Outlook
- 4.8 Natural-Gas Production & Consumption Outlook
- 4.9 Installed Pipeline Capacity Analysis
- 4.10 Unconventional Resources CAPEX Outlook (tight oil, oil sands, deep-water)
- 4.11 Porter's Five Forces
- 4.11.1 Bargaining Power - Suppliers
- 4.11.2 Bargaining Power - Buyers
- 4.11.3 Threat of New Entrants
- 4.11.4 Threat of Substitutes
- 4.11.5 Competitive Rivalry
- 4.12 PESTLE Analysis
5 Market Size & Growth Forecasts
- 5.1 By Sector
- 5.1.1 Upstream
- 5.1.2 Midstream
- 5.1.3 Downstream
- 5.2 By Location
- 5.2.1 Onshore
- 5.2.2 Offshore
- 5.3 By Service
- 5.3.1 Construction
- 5.3.2 Maintenance and Turn-around
- 5.3.3 Decommissioning
6 Competitive Landscape
- 6.1 Market Concentration
- 6.2 Strategic Moves (M&A, Partnerships, PPAs)
- 6.3 Market Share Analysis (Market Rank/Share for key companies)
- 6.4 Company Profiles (includes Global level Overview, Market level overview, Core Segments, Financials as available, Strategic Information, Products & Services, and Recent Developments)
- 6.4.1 Exxon Mobil Corp.
- 6.4.2 Chevron Corp.
- 6.4.3 ConocoPhillips Co.
- 6.4.4 EOG Resources Inc.
- 6.4.5 Occidental Petroleum Corp.
- 6.4.6 Pioneer Natural Resources Co.
- 6.4.7 Phillips 66 Co.
- 6.4.8 Valero Energy Corp.
- 6.4.9 Marathon Petroleum Corp.
- 6.4.10 Hess Corp.
- 6.4.11 Devon Energy Corp.
- 6.4.12 BP PLC
- 6.4.13 Shell PLC
7 Market Opportunities & Future Outlook
- 7.1 White-space & Unmet-need Assessment

