
PUBLISHER: Mordor Intelligence | PRODUCT CODE: 1934642

PUBLISHER: Mordor Intelligence | PRODUCT CODE: 1934642
Vietnam Oil And Gas - Market Share Analysis, Industry Trends & Statistics, Growth Forecasts (2026 - 2031)
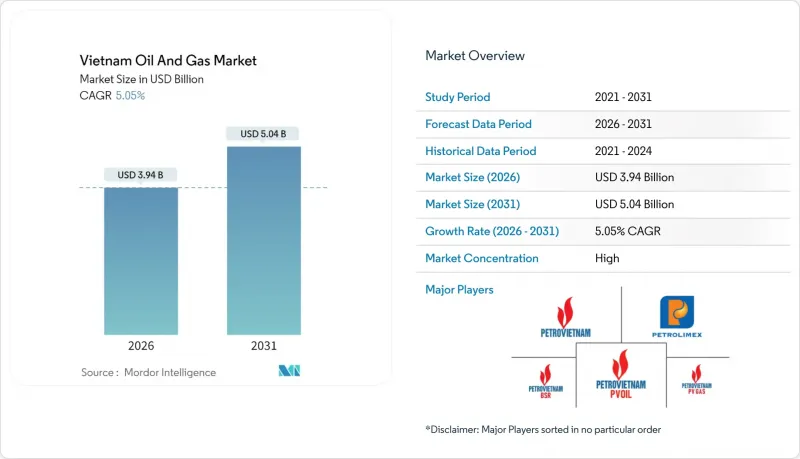
Vietnam Oil And Gas Market size in 2026 is estimated at USD 3.94 billion, growing from 2025 value of USD 3.75 billion with 2031 projections showing USD 5.04 billion, growing at 5.05% CAGR over 2026-2031.
This trajectory is rooted in Vietnam's deliberate shift toward energy security as domestic production declines and LNG-to-power investment accelerates under the National Power Development Plan VIII. Substantial upstream commitments-exemplified by the Block B - O Mon development with recoverable gas exceeding 170 billion m3-harmonize with rising import alliances that secure fuel flexibility for new gas-fired generation. Offshore exploration success, deeper reservoir targets, and indigenous rig fabrication collectively reinforce capital expenditure momentum. At the same time, downstream digitalization, stricter ESG rules, and a widening industrial gas customer base in foreign direct investment (FDI) parks are expanding mid- and downstream cash flows while nudging operators toward higher-margin maintenance and turnaround services. Together, these forces cultivate a medium-term opportunity set centered on asset optimization rather than pure greenfield capacity.
Vietnam Oil And Gas Market Trends and Insights
LNG-to-Power Push Under PDP-8
Vietnam's Power Development Plan VIII stipulates 22,524 MW of LNG-fired capacity by 2030, equal to roughly 10% of the national fleet.VN. Domestic gas output has been declining at a rate of approximately 5% annually since 2013, yet gas demand is forecast to increase from 13 billion m3 in 2020 to exceed 34 billion m3 by 2030. Capacity additions such as the Thi Vai terminal expansion to 7 million m3 per day in March 2025 underpin that pivot. PV Gas and Excelerate Energy have signed supply memoranda that lock in U.S. cargoes from 2026, bolstering feedstock diversity for Nhon Trach 3 and 4-the country's first fully integrated LNG-to-power chain. Together, these milestones embed LNG as a cornerstone of power-sector decarbonization.
Declining Domestic Output Spurs E&P Spend
Mature fields, such as Bach Ho and White Tiger, face rising water cuts and falling pressure, prompting operators to explore new reservoirs to stabilize the national supply. Murphy Oil committed USD 110 million for 2025-9% of its global budget-to drill Lac Da Vang and appraise Hai Su Vang, where the 1X well logged 370 ft of net pay over two reservoirs. PetroVietnam delivered Dai Hung Phase 3 twenty days ahead of schedule, demonstrating its domestic capacity to fast-track infill plans that counteract decline. Upcoming farm-outs in Blocks 15-1/05 and 15-2/17 aim to attract more risk capital by pairing production sharing terms with proven service infrastructure. Together, these programs allocate near-term cash flow to high-impact wells while extending field life through enhanced recovery.
Mature Fields & High Water-Cut Costs
Historic producers like Bach Ho now record water-cut levels above 80%, inflating separation expenses and squeezing margins. Engineering tweaks have trimmed jack-up repair cycles to five days, yet reservoir decline continues to erode volumes and elevate decommissioning liabilities. Capital-intensive enhanced recovery only partially offsets drop-offs, underscoring the need for new exploration.
Other drivers and restraints analyzed in the detailed report include:
- Gas-Fired Industrial Growth in FDI Parks
- Surge in Rigs for Block B & Blue Whale
- Price-Capped LNG-Power Tariffs
For complete list of drivers and restraints, kindly check the Table Of Contents.
Segment Analysis
The upstream segment accounted for 74.25% of Vietnam's oil and gas market in 2025 and is forecast to compound at a 5.38% CAGR to 2031, driven by deepwater spending on projects such as Block B - O Mon and Murphy Oil's Lac Da Vang program. This spending surge underwrites appraisal drilling that targets recoverable volumes exceeding 100 million barrels of oil equivalent (boe) and consolidates Vietnam's lead in the oil and gas market for exploration and production. Ongoing reservoir management at White Tiger and Phase 3 of Dai Hung exemplify the shift from primary recovery to secondary techniques, which prolong field life and sustain taxable output.
While midstream subsea pipelines and LNG reception facilities link offshore flows to urban demand centers, downstream refiners at Nghi Son and Dung Quat add capacity headroom from 6.5 million t/y to nearly 7.5 million t/y. Digital twins and AI-driven yield optimization reduce energy intensity and curtail off-spec volumes, thereby increasing profit per barrel despite stricter environmental regulations under the 2020 Environmental Protection Law.
The Vietnam Oil and Gas Market Report is Segmented by Sector (Upstream, Midstream, and Downstream), Location (Onshore and Offshore), and Service (Construction, Maintenance and Turn-Around, and Decommissioning). The Market Sizes and Forecasts are Provided in Terms of Value (USD).
List of Companies Covered in this Report:
- Vietnam Oil & Gas Group (PetroVietnam)
- Petrolimex Group
- PetroVietnam Gas (JSC)
- Binh Son Refining & Petrochemical (BSR)
- PetroVietnam Oil (PVOIL)
- PetroVietnam Power (PV Power)
- PetroVietnam Exploration & Production (PVEP)
- PetroVietnam Drilling (PVD)
- PetroVietnam Technical Services (PTSC)
- PetroVietnam Transportation (PV Trans)
- ExxonMobil Corp.
- TotalEnergies SE
- Chevron Corp.
- Idemitsu Kosan Co. Ltd
- Mitsui Oil Exploration
- Excelerate Energy Inc.
- Jadestone Energy plc
- Rosneft PJSC
- Japan Drilling Co. Ltd
- KS Energy Services Ltd
Additional Benefits:
- The market estimate (ME) sheet in Excel format
- 3 months of analyst support
TABLE OF CONTENTS
1 Introduction
- 1.1 Study Assumptions & Market Definition
- 1.2 Scope of the Study
2 Research Methodology
3 Executive Summary
4 Market Landscape
- 4.1 Market Overview
- 4.2 Market Drivers
- 4.2.1 LNG-to-Power Push Under PDP-8
- 4.2.2 Declining Domestic Output Spurs E&P Spend
- 4.2.3 Gas-Fired Industrial Growth in FDI Parks
- 4.2.4 Surge in Rigs for Block B & Blue Whale
- 4.2.5 Rapid Fuel-Retail Digitisation (PVOIL Easy)
- 4.2.6 U.S.-Vietnam LNG Supply Alliances
- 4.3 Market Restraints
- 4.3.1 Mature Fields & High Water-Cut Costs
- 4.3.2 Price-Capped LNG-Power Tariffs
- 4.3.3 Slow PSC & LNG Terminal Approvals
- 4.3.4 South China Sea Geopolitical Risk
- 4.4 Supply-Chain Analysis
- 4.5 Regulatory Landscape
- 4.6 Technological Outlook
- 4.7 Crude-Oil Production & Consumption Outlook
- 4.8 Natural-Gas Production & Consumption Outlook
- 4.9 Installed Pipeline Capacity Analysis
- 4.10 Unconventional Resources CAPEX Outlook (tight oil, oil sands, deep-water)
- 4.11 Porter's Five Forces
- 4.11.1 Threat of New Entrants
- 4.11.2 Bargaining Power of Suppliers
- 4.11.3 Bargaining Power of Buyers
- 4.11.4 Threat of Substitutes
- 4.11.5 Competitive Rivalry
- 4.12 PESTLE Analysis
5 Market Size & Growth Forecasts
- 5.1 By Sector
- 5.1.1 Upstream
- 5.1.2 Midstream
- 5.1.3 Downstream
- 5.2 By Location
- 5.2.1 Onshore
- 5.2.2 Offshore
- 5.3 By Service
- 5.3.1 Construction
- 5.3.2 Maintenance and Turn-around
- 5.3.3 Decommissioning
6 Competitive Landscape
- 6.1 Market Concentration
- 6.2 Strategic Moves (M&A, Partnerships, PPAs)
- 6.3 Market Share Analysis (Market Rank/Share for key companies)
- 6.4 Company Profiles (includes Global level Overview, Market level overview, Core Segments, Financials as available, Strategic Information, Products & Services, and Recent Developments)
- 6.4.1 Vietnam Oil & Gas Group (PetroVietnam)
- 6.4.2 Petrolimex Group
- 6.4.3 PetroVietnam Gas (JSC)
- 6.4.4 Binh Son Refining & Petrochemical (BSR)
- 6.4.5 PetroVietnam Oil (PVOIL)
- 6.4.6 PetroVietnam Power (PV Power)
- 6.4.7 PetroVietnam Exploration & Production (PVEP)
- 6.4.8 PetroVietnam Drilling (PVD)
- 6.4.9 PetroVietnam Technical Services (PTSC)
- 6.4.10 PetroVietnam Transportation (PV Trans)
- 6.4.11 ExxonMobil Corp.
- 6.4.12 TotalEnergies SE
- 6.4.13 Chevron Corp.
- 6.4.14 Idemitsu Kosan Co. Ltd
- 6.4.15 Mitsui Oil Exploration
- 6.4.16 Excelerate Energy Inc.
- 6.4.17 Jadestone Energy plc
- 6.4.18 Rosneft PJSC
- 6.4.19 Japan Drilling Co. Ltd
- 6.4.20 KS Energy Services Ltd
7 Market Opportunities & Future Outlook
- 7.1 White-Space & Unmet-Need Assessment

