
PUBLISHER: Mordor Intelligence | PRODUCT CODE: 1940706

PUBLISHER: Mordor Intelligence | PRODUCT CODE: 1940706
Africa Glass Bottles And Containers - Market Share Analysis, Industry Trends & Statistics, Growth Forecasts (2026 - 2031)
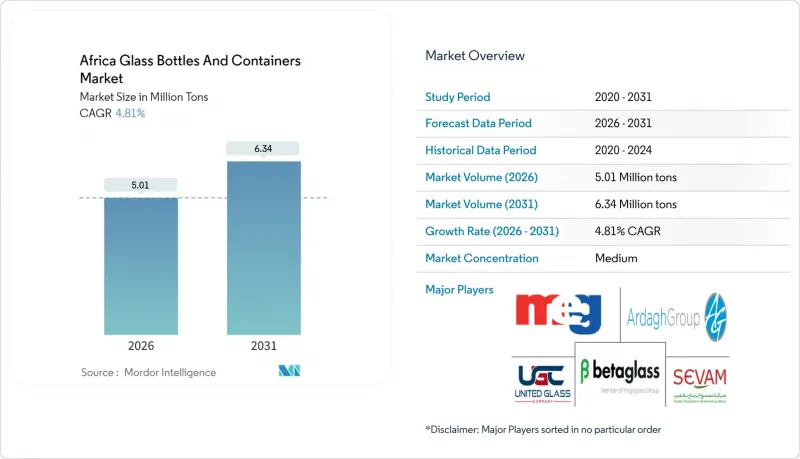
The Africa Glass Bottles And Containers Market was valued at 4.78 Million tons in 2025 and estimated to grow from 5.01 Million tons in 2026 to reach 6.34 Million tons by 2031, at a CAGR of 4.81% during the forecast period (2026-2031).
Accelerating beverage consumption, regulatory momentum for recyclable materials, and an expanding urban middle-class underpin the upswing, while trade facilitation under AfCFTA broadens addressable volumes and premium-packaged export flows. Competitive intensity remains moderate because a handful of regional leaders control furnace capacity, yet new entrants leverage technological upgrades and localized supply chains to chip away at incumbents. End-user preferences increasingly tilt toward clear and lightweight premium bottles that reinforce brand image, even as energy prices and foreign-exchange volatility add cost pressure. Against this backdrop, the Africa glass bottles and containers market continues to outpace overall packaging growth trajectories, confirming its role as a strategic channel for beverage, food, and cosmetics brands aiming to signal product quality and sustainability.
Africa Glass Bottles And Containers Market Trends and Insights
Rising beverage consumption and premium-packaging demand
Africa's beverage output hit 141 million hectoliters in 2021, a 7% jump that outpaced all other regions. This volume growth anchors the expansion of the Africa glass bottles and containers market as multinational bottlers deepen footprints and local craft brewers upgrade presentation. South Africa alone produced 31 million hectoliters and has added new brewing lines to support premium lager variants, while Coca-Cola Beverages Africa invested USD 50 million in Namibia to lift throughput 30% at 27,000 bph, all packed in glass.Premium cues tied to clarity, weight, and perceived product integrity nudge consumers toward glass over PET in urban channels, and the same attributes bolster shelf-life for alcohol exports that now traverse tariff-light AfCFTA corridors. Consequently, brand owners view the Africa glass bottles and containers market as a margin-accretive packaging choice that aligns with sustainability commitments.
Regulatory push for food-grade, recyclable packaging
Extended Producer Responsibility (EPR) rules are tightening across key geographies, reshaping material selection in favor of closed-loop compatible containers. South Africa's EPR framework became effective in May 2021 and targets a 65% glass-recycling rate by 2026. Kenya followed with the Sustainable Waste Management Act 2022, mandating four-year compliance plans overseen by NEMA. Morocco's ONSSA standards require food-grade packaging with bilingual labeling, while Egypt's conformity program screens imports before market entry. Glass naturally satisfies recyclability thresholds and avoids migration risks that plastics face, cementing its long-term relevance. Industry association FEVE underscores that well-designed EPR schemes deliver higher closed-loop rates than deposit systems, validating policy direction.
Proliferation of PET and aluminium lightweight formats
Lightweight PET bottles and aluminum cans erode share by offering freight and handling savings that resonate with cost-squeezed beverage fillers. Economic turbulence in Nigeria prompted several multinationals to opt for cheaper substrates, an example being recent portfolio shifts by large CSD brands. Barrier-coated PET now achieves near-glass oxygen transmission rates, while can-makers leverage established recycling networks to position aluminum as a circular option. Glass suppliers counter with lightweighting breakthroughs such as 180 g spirit bottles, yet mass-production scalability and capital intensity temper rapid rollouts. The tug-of-war narrows the short-term growth outlook for the Africa glass bottles and containers market.
Other drivers and restraints analyzed in the detailed report include:
- Urban middle-class expansion boosting beer and CSD volumes
- AfCFTA-driven intra-Africa trade in glass-packaged goods
- High energy-input and power-reliability costs
For complete list of drivers and restraints, kindly check the Table Of Contents.
Segment Analysis
Beverage applications captured 62.12% of the Africa glass bottles and containers market size in 2025, underpinning overall tonnage because beer, wine, and carbonated drinks prize the material's barrier performance and premium shelf appeal. Beer remains the largest consumer on the back of South Africa's 31 million hectoliters output and Nigeria's capacity additions, while spirits leverage heavy flint bottles to reinforce brand stature. Carbonated soft-drink bottlers are investing in returnable-glass loops to align with consumer sustainability expectations and to safeguard flavor integrity.
Cosmetics and personal care, though starting from a lower baseline, are forecast to grow at a 5.14% CAGR through 2031, the fastest among end-users. Rising disposable incomes spur demand for serums, fragrances, and high-value skincare packaged in ornate flint or colored glass. Local beauty entrepreneurs in Nairobi and Johannesburg adopt smaller bottle formats to facilitate e-commerce fulfillment, creating ancillary demand pockets within the Africa glass bottles and containers market. Food, pharmaceutical, and chemical niches provide stable but comparatively lower volumes, reflecting regulated specifications and inventory strategies favoring local production runs.
The Africa Glass Bottles and Containers Market Report is Segmented by End-User (Beverages [Alcoholic {Beer, Wine, Spirits, and More}, and Non-Alcoholic {Carbonated Drinks (CSDs), Dairy Product Based Drinks, and More}], Food [Jam and Jelly, Condiments and Sauces, and More], Cosmetics and Personal Care, and More), Color (Flint, Amber, Green, and More) and Country. The Market Forecasts are Provided in Terms of Volume (Tons).
List of Companies Covered in this Report:
- Ardagh Group S.A.
- Middle East Glass Manufacturing Company S.A.E.
- Beta Glass PLC
- Isanti Glass 1 (Pty) Ltd
- Kandil Glass
- Saverglass SAS
- Consol Glass Pty Ltd
- African Glass Limited
- The National Company for Glass and Crystal S.A.E.
- Verallia Packaging S.A.S.
- Gerresheimer AG
- Arab Pharmaceutical Glass Company S.A.E.
- Dalgen Packaging CC
- Nampak Limited
- O-I Glass, Inc.
- United Glass Containers Company (UGC)
- Societe d'Exploitation de Verreries au Maroc (SEVAM)
Additional Benefits:
- The market estimate (ME) sheet in Excel format
- 3 months of analyst support
TABLE OF CONTENTS
1 INTRODUCTION
- 1.1 Study Assumptions and Market Definition
- 1.2 Scope of the Study
2 RESEARCH METHODOLOGY
3 EXECUTIVE SUMMARY
4 MARKET LANDSCAPE
- 4.1 Market Overview
- 4.2 Market Drivers
- 4.2.1 Rising beverage consumption and premium-packaging demand
- 4.2.2 Regulatory push for food-grade, recyclable packaging
- 4.2.3 Urban middle-class expansion boosting beer and CSD volumes
- 4.2.4 AfCFTA-driven intra-Africa trade in glass-packaged goods
- 4.2.5 Craft alcohol and artisan spirits boom (short-run premium glass)
- 4.2.6 EU CBAM pressure on low-carbon export packaging
- 4.3 Market Restraints
- 4.3.1 Proliferation of PET and aluminium lightweight formats
- 4.3.2 High energy-input and power-reliability costs
- 4.3.3 Poor cullet-collection and recycling infrastructure
- 4.3.4 FX volatility and soda-ash import tariffs
- 4.4 Industry Supply-Chain Analysis
- 4.5 Container Glass Furnace Capacity and Locations in Africa
- 4.5.1 Plant Locations and Year of Commencement
- 4.5.2 Production Capacities
- 4.5.3 Types of Furnaces
- 4.5.4 Color of Glass Produced
- 4.6 Export-Import Data of Container Glass - Covering Key Import and Export Destinations
- 4.6.1 Import Volume & Value, 2021-2024
- 4.6.2 Export Volume & Value, 2021-2024
- 4.7 Porter's Five Forces Analysis
- 4.7.1 Threat of New Entrants
- 4.7.2 Bargaining Power of Suppliers
- 4.7.3 Bargaining Power of Buyers
- 4.7.4 Threat of Substitutes
- 4.7.5 Competitive Rivalry
- 4.8 Raw Material Analysis
- 4.9 Recycling Trends for Glass Packaging
- 4.10 Demand vs Supply Analysis for Glass Packaging
5 MARKET SIZE AND GROWTH FORECASTS (VOLUME)
- 5.1 By End-user
- 5.1.1 Beverages
- 5.1.1.1 Alcoholic
- 5.1.1.1.1 Beer
- 5.1.1.1.2 Wine
- 5.1.1.1.3 Spirits
- 5.1.1.1.4 Other Alcoholic Beverages (Cider and Other Fermented Drinks)
- 5.1.1.2 Non-Alcoholic
- 5.1.1.2.1 Juices
- 5.1.1.2.2 Carbonated Drinks (CSDs)
- 5.1.1.2.3 Dairy Product Based Drinks
- 5.1.1.2.4 Other Non-Alcoholic Beverages
- 5.1.1.1 Alcoholic
- 5.1.2 Food (Jam, Jelly, Marmalades, Honey, Sausages and Condiments, Oil, Pickles)
- 5.1.3 Cosmetics and Personal Care
- 5.1.4 Pharmaceuticals (excluding Vials and Ampoules)
- 5.1.5 Perfumery
- 5.1.1 Beverages
- 5.2 By Color
- 5.2.1 Green
- 5.2.2 Amber
- 5.2.3 Flint
- 5.2.4 Other Colors
- 5.3 By Country
- 5.3.1 Egypt
- 5.3.2 Nigeria
- 5.3.3 Kenya
- 5.3.4 Morocco
- 5.3.5 South Africa
- 5.3.6 Rest of Africa
6 COMPETITIVE LANDSCAPE
- 6.1 Market Concentration
- 6.2 Strategic Moves and Developments
- 6.3 Company Market Share Analysis, (Based on Latest Production Capacity)
- 6.4 Company Profiles (includes Global level Overview, Market level overview, Core Segments, Financials as available, Strategic Information, Market Rank/Share for key companies, Products and Services, and Recent Developments)
- 6.4.1 Ardagh Group S.A.
- 6.4.2 Middle East Glass Manufacturing Company S.A.E.
- 6.4.3 Beta Glass PLC
- 6.4.4 Isanti Glass 1 (Pty) Ltd
- 6.4.5 Kandil Glass
- 6.4.6 Saverglass SAS
- 6.4.7 Consol Glass Pty Ltd
- 6.4.8 African Glass Limited
- 6.4.9 The National Company for Glass and Crystal S.A.E.
- 6.4.10 Verallia Packaging S.A.S.
- 6.4.11 Gerresheimer AG
- 6.4.12 Arab Pharmaceutical Glass Company S.A.E.
- 6.4.13 Dalgen Packaging CC
- 6.4.14 Nampak Limited
- 6.4.15 O-I Glass, Inc.
- 6.4.16 United Glass Containers Company (UGC)
- 6.4.17 Societe d'Exploitation de Verreries au Maroc (SEVAM)
7 MARKET OPPORTUNITIES AND FUTURE OUTLOOK
- 7.1 White-space and Unmet-Need Assessment

