
PUBLISHER: Mordor Intelligence | PRODUCT CODE: 2044139

PUBLISHER: Mordor Intelligence | PRODUCT CODE: 2044139
Commercial Real Estate - Market Share Analysis, Industry Trends & Statistics, Growth Forecasts (2026 - 2031)
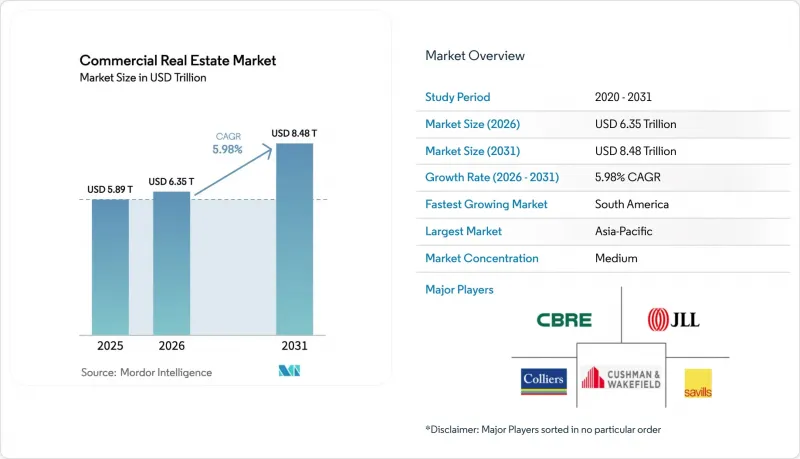
The commercial real estate market size stands at USD 6,345.2 billion in 2026 and is projected to reach USD 8,483.3 billion by 2031, reflecting a 5.98% CAGR.
Capital reallocation by sovereign wealth funds and pension plans toward income-producing property supports steady expansion in the commercial real estate market, even as rate pressures ease. Digitalization continues to reshape demand patterns, with data centers, logistics, and last-mile facilities absorbing new capital and driving build pipelines in select power-rich and transit-rich locations in the commercial real estate market. Hybrid work has stabilized at midweek peaks and lower weekly averages, which keeps national office vacancy near multi-decade highs, and it reinforces a flight to quality in the commercial real estate market. Construction and insurance costs remain elevated relative to pre-2024 trends, which compresses yields for new builds and deep retrofits and further segments winners and underperformers in the commercial real estate market.
Global Commercial Real Estate Market Trends and Insights
Sovereign & Pension-Fund Pivot Toward Income-Producing CRE
Sovereign investors and pension plans increased allocations to income-producing property, which bolsters liquidity in core segments and strengthens bid depth for logistics, multifamily, and digital infrastructure. State investors and pensions grew global deployment in 2025, with the U.S. absorbing a large share focused on digital infrastructure and AI-linked assets. Gulf-based sovereign investors contributed a significant portion of state capital, while North American and Nordic pensions continued to favor long-lease assets with high-credit tenancy. Cross-border capital into the U.S. rose in early 2025 with Canadian, Norwegian, and U.K. investors active in industrial, multistory warehouses, and sale-leaseback deals. Policy direction on defined-contribution plans in the U.S. may unlock new flows to private assets, which supports long-term funding for rental-heavy strategies. Energy- and commodity-backed sovereign funds are positioned to sustain allocations in 2026, while hydrocarbon-dependent funds manage fiscal trade-offs in capital deployment.
Logistics-Led Demand Spike From Omnichannel Retail
Retailers' shift to omnichannel fulfillment elevates the value of modern logistics assets with high-clear heights and efficient throughput. Retailers need about three times as much warehouse space per dollar of online sales as for store-based channels, which increases demand for modern distribution nodes in key corridors. Store networks are doubling as hubs for click-and-collect and ship-from-store activity as executives push convenience and localized inventory, which reinforces last-mile demand in the commercial real estate market. Micro-fulfillment footprints continue to cluster in denser submarkets to improve delivery times and to lower final-leg costs for retailers that run integrated inventory across channels. Developers prioritize sites near customers and multimodal transit, while bonded warehouses and cross-border facilities secure premium leases due to tariff and supply-chain risk management. Together, these shifts consolidate growth in e-commerce-driven logistics and elevate requirements for power, HVAC, and automation-ready designs in the commercial real estate market.
Persistent Hybrid-Work Dampening Global Office Absorption
Hybrid schedules have settled into stable patterns where most mandates require three to four days in the office, which sustains a gap to full-week utilization. As of early 2026, only a small share of large-company staff remain fully remote, which is down sharply from 2022, yet national vacancy in the U.S. stayed high through mid-2025. Rolling absorption remained below historical norms during 2024 and 2025, consistent with rightsizing and footprint optimization. Coastal metros recorded sizable negative absorption in 2024, while interior markets showed more resilience. Space per worker continued to compress to near 122 square feet by 2025 as tenants reconfigured for more collaboration areas and fewer assigned seats. Canadian sublease availability improved into late 2024, but downtown vacancy remained elevated, which signals a gradual rather than sudden recovery path.
Other drivers and restraints analyzed in the detailed report include:
- Rapid Hyperscale & Edge Data-Center Campus Roll-Outs
- Flight-To-Quality Upgrading Of Prime CBD Offices
- Construction-Material & Financing-Cost Inflation Squeezing Yields
For complete list of drivers and restraints, kindly check the Table Of Contents.
Segment Analysis
Offices commanded a 35% share in 2025, which reflects legacy leasing commitments and the slow adjustment cycle for enterprise footprints. The logistics and industrial portion of the commercial real estate market size is projected to expand at a 6.32% CAGR through 2031 as omnichannel retailers reconfigure inventory placement for speed. Retailers require significantly more warehouse capacity per online sales dollar than traditional channels, which supports high-clear, automation-ready buildings in urban and near-port locations. Micro-fulfillment facilities are gaining share inside and near cities as retailers emphasize same-day service, which boosts demand for smaller footprints with robust HVAC and power. Last-mile sites near multimodal nodes and bonded warehouses close to borders continue to command rent premiums, which widens the performance gap versus older stock.
Retail centers stabilized at low vacancy as experiential and convenience formats regained traffic, and many storefronts now support online order fulfillment to diversify sales. Large logistics platforms deployed capital to expand regional coverage, as seen in sizeable portfolio purchases across Sun Belt corridors to meet e-commerce demand in the commercial real estate market. Policy and regulation are reinforcing portfolio bifurcation because energy-performance mandates and city-level emissions rules make compliant assets more attractive for core buyers. Deep retrofits are now a central tool for office repositioning, and capital plans are shifting toward targeted upgrades where long-term tenancy is feasible. As developers navigate cost inflation and permitting constraints, modern logistics continues to outgrow other property types on the back of consistent tenant demand in the commercial real estate market.
The Commercial Real Estate Market Size Report is Segmented by Property Type (Offices, Retail, Logistics and More), by Business Model (Sales, Rental), by End-User (Individuals / Households, Corporates & SMEs and More) and by Region (North America, South America, Europe, Asia-Pacific & Middle East and Africa). The Market Forecasts are Provided in Terms of Value (USD).
Geography Analysis
Asia-Pacific held a 33% share in 2025, supported by strong industrial output, tight prime-office corridors in Japan, and robust absorption in India's technology and shared-services hubs. Wage gains and policy direction in Japan lifted Tokyo prime rents in late 2025, while Australia's urban markets benefited from internal migration and pre-Olympics infrastructure programs. Singapore and Hong Kong SAR faced land and power constraints for data centers, yet institutional interest in rental housing formats remained steady in undersupplied submarkets. India's global capability centers and BFSI tenants supported occupancy and rent growth in major markets during 2025, which underscores diversified demand drivers in the commercial real estate market. This mix keeps Asia-Pacific as the share leader while growth normalizes from the immediate post-pandemic period.
South America records the fastest projected regional growth at 6.46% through 2031 as foreign direct investment shifts toward industrial and logistics expansion. Major industrial markets in Mexico and Brazil anchored pipelines in 2025 as investors targeted distribution corridors with power and labor availability. Recovery and stabilization in several capital city office markets signaled improving momentum despite elevated vacancy in select metros. Macroeconomic stabilization, moderating inflation in several countries, and continued FDI support a stronger platform for development and leasing. These fundamentals position the region for durable gains in the commercial real estate market.
North America and Europe expand at steadier rates as capital focuses on digital infrastructure, logistics, and prime office assets that meet high ESG standards. State investors deployed more capital into U.S. digital infrastructure and AI-linked assets in 2025, which sharpened the focus on hyperscale locations with expandable power. Canada's investment flows rose in key metros in 2025, supported by migration and provincial growth, which kept leasing active in favored segments. Surveyed European investors expected improved leasing and financing conditions in 2026, which points to a firmer base after a slow 2024 for transactions in the commercial real estate market. Refinancing exposure remains largest in Germany and France, and potential fiscal programs could catalyze new activity if policy clarity improves. London retained top-tier city status for depth and liquidity heading into 2026, while Madrid moved up on economic and quality-of-life metrics.
- CBRE
- JLL (Jones Lang LaSalle)
- Cushman & Wakefield
- Colliers
- Savills
- Newmark
- Knight Frank
- Eastdil Secured
- Prologis
- GLP
- Goodman Group
- Simon Property Group
- Unibail-Rodamco-Westfield
- Brookfield Asset Management (Real Estate)
- Blackstone Real Estate
- Hines
- Vornado Realty Trust
- Boston Properties
- Mitsubishi Estate
- CapitaLand
- Keppel Land
- Link REIT
Additional Benefits:
- The market estimate (ME) sheet in Excel format
- 3 months of analyst support
TABLE OF CONTENTS
1 Introduction
- 1.1 Study Assumptions & Market Definition
- 1.2 Scope of the Study
2 Research Methodology
3 Executive Summary
4 Market Insights and Dynamics
- 4.1 Market Overview
- 4.2 Commercial Real Estate Buying Trends - Socio-economic & Demographic Insights
- 4.3 Rental Yield Analysis
- 4.4 Capital-Market Penetration & REIT Presence
- 4.5 Regulatory Outlook
- 4.6 Technological Outlook
- 4.7 Insights into Existing and Upcoming Projects
- 4.8 Market Drivers
- 4.8.1 Logistics-led demand spike from omnichannel retail
- 4.8.2 Flight-to-quality upgrading of prime CBD offices
- 4.8.3 Sovereign & pension-fund pivot toward income-producing CRE
- 4.8.4 Rapid hyperscale & edge data-centre campus roll-outs
- 4.8.5 Transit-oriented rezoning lifting mixed-use land values
- 4.8.6 Generative-AI-driven site-selection boosting secondary markets
- 4.9 Market Restraints
- 4.9.1 Persistent hybrid-work dampening global office absorption
- 4.9.2 Construction-material & financing-cost inflation squeezing yields
- 4.9.3 ESG-driven obsolescence risk for legacy assets
- 4.9.4 Heightened climate-insurance premia in coastal metros
- 4.10 Value / Supply-Chain Analysis
- 4.10.1 Overview
- 4.10.2 Real Estate Developers and Contractors - Key Quantitative and Qualitative Insights
- 4.10.3 Real Estate Brokers and Agents - Key Quantitative and Qualitative Insights
- 4.10.4 Property Management Companies - Key Quantitative and Qualitative Insights
- 4.10.5 Insights on Valuation Advisory and Other Real Estate Services
- 4.10.6 State of the Building Materials Industry and Partnerships with Key Developers
- 4.10.7 Insights on Key Strategic Real Estate Investors/Buyers in the Market
- 4.11 Porters Five Forces
- 4.11.1 Threat of New Entrants
- 4.11.2 Bargaining Power of Suppliers
- 4.11.3 Bargaining Power of Buyers
- 4.11.4 Threat of Substitutes
- 4.11.5 Competitive Rivalry
5 Market Size & Growth Forecasts (Value, USD)
- 5.1 By Property Type
- 5.1.1 Offices
- 5.1.2 Retail
- 5.1.3 Logistics
- 5.1.4 Others (Industrial Parks, Hospitality, Mixed-Use)
- 5.2 By Business Model
- 5.2.1 Sales
- 5.2.2 Rental
- 5.3 By End-User (Value)
- 5.3.1 Individuals / Households
- 5.3.2 Corporates & SMEs
- 5.3.3 Others (Institutions, Government, NGOs)
- 5.4 By Geography
- 5.4.1 North America
- 5.4.1.1 United States
- 5.4.1.2 Canada
- 5.4.1.3 Mexico
- 5.4.2 Europe
- 5.4.2.1 Germany
- 5.4.2.2 United Kingdom
- 5.4.2.3 France
- 5.4.2.4 Italy
- 5.4.2.5 Spain
- 5.4.2.6 Rest of Europe
- 5.4.3 Asia - Pacific
- 5.4.3.1 China
- 5.4.3.2 India
- 5.4.3.3 Japan
- 5.4.3.4 South Korea
- 5.4.3.5 Australia
- 5.4.3.6 Rest of Asia - Pacific
- 5.4.4 South America
- 5.4.4.1 Brazil
- 5.4.4.2 Argentina
- 5.4.4.3 Chile
- 5.4.4.4 Rest of South America
- 5.4.5 Middle East and Africa
- 5.4.5.1 United Arab Emirates
- 5.4.5.2 Saudi Arabia
- 5.4.5.3 South Africa
- 5.4.5.4 Nigeria
- 5.4.5.5 Rest of Middle East and Africa
- 5.4.1 North America
6 Competitive Landscape
- 6.1 Market Concentration
- 6.2 Strategic Moves
- 6.3 Market Share Analysis
- 6.4 Company Profiles {(includes Global level Overview, Market level overview, Core Segments, Financials as available, Strategic Information, Market Rank/Share for key companies, Products & Services, and Recent Developments)}
- 6.4.1 CBRE
- 6.4.2 JLL (Jones Lang LaSalle)
- 6.4.3 Cushman & Wakefield
- 6.4.4 Colliers
- 6.4.5 Savills
- 6.4.6 Newmark
- 6.4.7 Knight Frank
- 6.4.8 Eastdil Secured
- 6.4.9 Prologis
- 6.4.10 GLP
- 6.4.11 Goodman Group
- 6.4.12 Simon Property Group
- 6.4.13 Unibail-Rodamco-Westfield
- 6.4.14 Brookfield Asset Management (Real Estate)
- 6.4.15 Blackstone Real Estate
- 6.4.16 Hines
- 6.4.17 Vornado Realty Trust
- 6.4.18 Boston Properties
- 6.4.19 Mitsubishi Estate
- 6.4.20 CapitaLand
- 6.4.21 Keppel Land
- 6.4.22 Link REIT
7 Market Opportunities & Future Outlook
- 7.1 White-space & unmet-need assessment

