
PUBLISHER: Mordor Intelligence | PRODUCT CODE: 2061552

PUBLISHER: Mordor Intelligence | PRODUCT CODE: 2061552
Malaysia Commercial Real Estate - Market Share Analysis, Industry Trends & Statistics, Growth Forecasts (2026 - 2031)
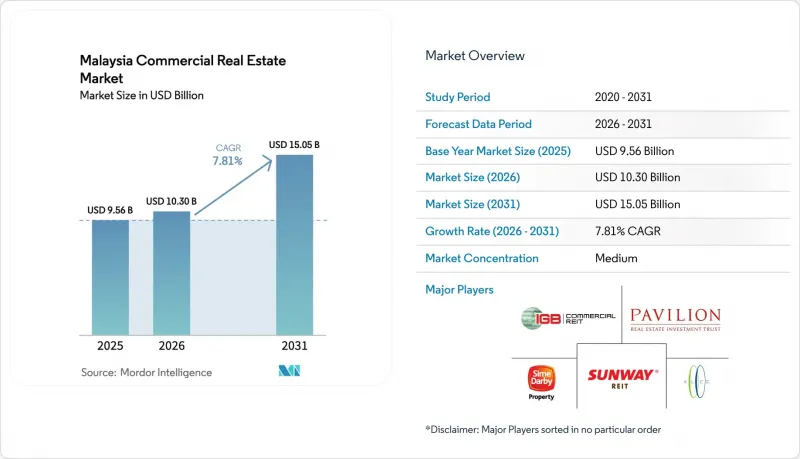
According to Mordor Intelligence, the malaysia commercial real estate market size is projected to expand from USD 9.56 billion in 2025 and USD 10.30 billion in 2026 to USD 15.05 billion by 2031, registering a CAGR of 7.81% between 2026 to 2031.
This report is Segmented by Property Type (Offices, Retail, Logistics and Others), by Business Model (Sales and Rental), by End-User (Individuals/Households, Corporates & SMEs and Others), and by Geography (Kuala Lumpur, Klang, Petaling Jaya, Johor Bahru, Penang and the Rest of Malaysia). The Market Forecasts are Provided in Terms of Value (USD).
Malaysia Commercial Real Estate Market Trends and Insights
Record Manufacturing and Digital FDI Fueling Industrial and Logistics Uptake
Malaysia approved USD 94.8 billion of FDI in 2025, 11% above 2024, with Penang attracting USD 5 billion for chip and electronics expansion. Industrial vacancy dipped from 3.9% to 2.0% in a single quarter as 2.1 million square feet of Grade-A sheds were absorbed. Third-party logistics groups lease 49% of prime floor area, contrasting with e-tailers' 6% slice, which indicates deeper outsourcing of fulfillment. Penang land now costs USD 14-19 per square foot, yet multinationals sign 10-15 year leases that escalate 2-3% annually, locking predictable cash flows for REIT buyers like Axis. Sale-leasebacks, exemplified by a USD 178 million Seberang Perai deal, continue to convert fixed assets into capex budgets for manufacturers.
Mega-infrastructure completions catalyzing transit-oriented developments
The Rapid Transit System Link reached 65% completion in November 2025, with trial runs slated for July 2026. Land within a 500 meter radius of Bukit Chagar appreciated 43-114% over three years, drawing offices, hotels, and malls into vertically integrated precincts. Penang's USD 0.95 billion Straits City, anchored by a 343-room Crowne Plaza that opened in February 2025, shows how state grants derisk private capital. Developers can still lock in sites at pre-commuter-traffic prices because occupancy normally lags rail handover by about two years. Similar upside is anticipated around Kuala Lumpur's Mass Rapid Transit 3 once approvals clear in 2026.
Klang Valley Office Oversupply Maintaining Elevated Vacancy
Combined office inventory reached 121.7 million square feet in 4Q 2024, pushing vacancy to 28.3%. Yet Kuala Lumpur Fringe posted only 6.7% vacancy in 4Q 2025 because tenants gravitated toward transit-served submarkets. New construction dries up after The Capitol delivers in 2027, signaling that natural absorption should erode excess space by 2029 if hiring holds. Secondary landlords now grant fitting-out allowances of around USD 18-27 per square foot and lengthy rent-free periods, shrinking effective income. Conversion to residential is under policy review and could remove obsolete floors from supply.
Other drivers and restraints analyzed in the detailed report include:
- E-Commerce-Led Last-Mile Logistics and Dark-Store Demand Surge
- Johor-Singapore SEZ Early-Bird Incentives Sparking Cross-Border Relocations
- Volatile Construction Input Costs Squeezing Developer Margins
For complete list of drivers and restraints, kindly check the Table Of Contents.
Segment Analysis
Office retained the largest 30% slice but contends with 28.3% Klang Valley vacancy, while Grade-A green towers enjoy healthy leasing. Logistics momentum rests on shrinking industrial vacancy of 2.0% as 3PLs pre-leased 2.1 million square feet and e-commerce gross merchandise value marches toward USD 29 billion by 2030. Power access is the new bottleneck, illustrated by data-center queues for 3.2 gigawatts of additional capacity. Retail stabilizes, shown by Pavilion REIT guiding toward 95% mall occupancy, and hospitality gains from Visit Malaysia 2026 with more than 2,000 five-star rooms added through Hyatt and JW Marriott openings. Environmental retrofits remain vital because non-compliant towers pay loan spreads up to 1%, hurting office cash flows, whereas warehouses require fewer ESG upgrades to remain marketable.
The Malaysia commercial real estate market share edge enjoyed by offices is eroding as institutional capital pivots toward logistics. Axis REIT's USD 178 million Seberang Perai land purchase on an eight-year leaseback exemplifies appetite for long-income industrial. Meanwhile, green premiums let owners such as JLL Malaysia's WELL Gold Menara IQ charge USD 1.70 per square foot monthly, versus sub-USD 1.30 elsewhere. Long term, mixed-use precincts near rail nodes will blend office, retail, and logistics micro-hubs, smoothing the cycle volatility.
List of Companies Covered in this Report:
- KLCC Property Holdings Bhd
- Sunway REIT
- Pavilion REIT
- IGB REIT
- Sime Darby Property Bhd
- S P Setia Bhd
- UEM Sunrise Bhd
- Gamuda Bhd
- IJM Corporation Bhd
- YTL Corporation Bhd
- Conlay Construction Sdn Bhd
- Ho Hup Construction Bhd
- Renzo Builders (M) Sdn Bhd
- China Construction Development (Malaysia) Sdn Bhd
- NS Construction
- Malaysian Resources Corporation Bhd
Additional Benefits:
- The market estimate (ME) sheet in Excel format
- 3 months of analyst support
TABLE OF CONTENTS
1 Introduction
- 1.1 Study Assumptions & Market Definition
- 1.2 Scope of the Study
2 Research Methodology
3 Executive Summary
4 Market Landscape
- 4.1 Market Overview
- 4.2 Commercial Real Estate Buying Trends - Socio-economic & Demographic Insights
- 4.3 Rental Yield Analysis
- 4.4 Capital-Market Penetration & REIT Presence
- 4.5 Regulatory Outlook
- 4.6 Technological Outlook
- 4.7 Insights into Existing and Upcoming Projects
- 4.8 Market Drivers
- 4.8.1 Record manufacturing and digital FDI fueling industrial and logistics uptake
- 4.8.2 Mega-infrastructure completions catalyzing transit-oriented developments
- 4.8.3 E-commerce-led last-mile logistics and dark-store demand surge
- 4.8.4 Johor-Singapore SEZ early-bird incentives sparking cross-border relocations
- 4.8.5 Flight-to-quality and ESG demand for Grade-A, green, WELL-certified offices
- 4.8.6 REIT-driven strata break-up unlocking affordable fractional ownership
- 4.9 Market Restraints
- 4.9.1 Klang Valley office oversupply maintaining elevated vacancy
- 4.9.2 Volatile construction input costs squeezing developer margins
- 4.9.3 ESG-linked financing tightening for non-compliant brown assets
- 4.9.4 Grid-capacity bottlenecks limiting power-dense data-centre expansion
- 4.10 Value / Supply-Chain Analysis
- 4.10.1 Overview
- 4.10.2 Real Estate Developers & Contractors - Key Quantitative & Qualitative Insights
- 4.10.3 Real Estate Brokers & Agents - Key Quantitative & Qualitative Insights
- 4.10.4 Property Management Companies - Key Quantitative & Qualitative Insights
- 4.10.5 Insights on Valuation Advisory & Other Real Estate Services
- 4.10.6 State of the Building Materials Industry & Partnerships with Key Developers
- 4.10.7 Insights on Key Strategic Real Estate Investors/Buyers in the Market
- 4.11 Industry Attractiveness - Porter's Five Forces Analysis
- 4.11.1 Threat of New Entrants
- 4.11.2 Bargaining Power of Buyers/Occupiers
- 4.11.3 Bargaining Power of Suppliers (Developers/Builders)
- 4.11.4 Threat of Substitutes
- 4.11.5 Competitive Rivalry Intensity
5 Market Size & Growth Forecasts (Value, USD Billion)
- 5.1 By Property Type
- 5.1.1 Offices
- 5.1.2 Retail
- 5.1.3 Logistics
- 5.1.4 Others (industrial real estate, hospitality real estate, etc.)
- 5.2 By Business Model
- 5.2.1 Sales
- 5.2.2 Rental
- 5.3 By End-user
- 5.3.1 Individuals / Households
- 5.3.2 Corporates & SMEs
- 5.3.3 Others
- 5.4 By Geography
- 5.4.1 Kuala Lumpur
- 5.4.2 Klang
- 5.4.3 Petaling Jaya
- 5.4.4 Johor Bahru
- 5.4.5 Penang (George Town, Seberang Perai)
- 5.4.6 Rest of Malaysia
6 Competitive Landscape
- 6.1 Market Concentration
- 6.2 Strategic Moves
- 6.3 Market Share Analysis
- 6.4 Company Profiles (includes Global level Overview, Market level overview, Core Segments, Financials as available, Strategic Information, Products & Services, and Recent Developments)
- 6.4.1 KLCC Property Holdings Bhd
- 6.4.2 Sunway REIT
- 6.4.3 Pavilion REIT
- 6.4.4 IGB REIT
- 6.4.5 Sime Darby Property Bhd
- 6.4.6 S P Setia Bhd
- 6.4.7 UEM Sunrise Bhd
- 6.4.8 Gamuda Bhd
- 6.4.9 IJM Corporation Bhd
- 6.4.10 YTL Corporation Bhd
- 6.4.11 Conlay Construction Sdn Bhd
- 6.4.12 Ho Hup Construction Bhd
- 6.4.13 Renzo Builders (M) Sdn Bhd
- 6.4.14 China Construction Development (Malaysia) Sdn Bhd
- 6.4.15 NS Construction
- 6.4.16 Malaysian Resources Corporation Bhd
7 Market Opportunities & Future Outlook
- 7.1 White-Space & Unmet-Need Assessment

