
PUBLISHER: Mordor Intelligence | PRODUCT CODE: 2061499

PUBLISHER: Mordor Intelligence | PRODUCT CODE: 2061499
Nuclear Imaging - Market Share Analysis, Industry Trends & Statistics, Growth Forecasts (2026 - 2031)
According to Mordor Intelligence, the nuclear imaging market size is expected to increase from USD 17.81 billion in 2025 to USD 19.15 billion in 2026 and reach USD 27.57 billion by 2031, growing at a CAGR of 7.55% over 2026-2031.
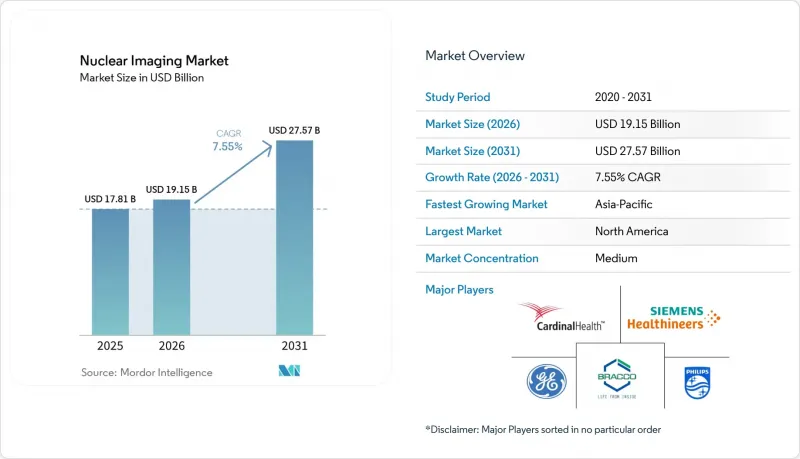
This report is Segmented by Product (PET Scanners and SPECT Scanners), Application (SPECT and PET Applications), End User (Hospitals, Diagnostic Imaging Centres, Academic & Research Institutes), and Geography (North America, Europe, Asia-Pacific, Middle East and Africa, and More). The Market Forecasts are Provided in Terms of Value (USD).
Global Nuclear Imaging Market Trends and Insights
Rising Cancer and Cardiovascular Disease Incidence
Global oncology and cardiology case loads continue to climb, creating durable demand for both diagnostic imaging and therapeutic radiopharmaceuticals. FDA approval of Lu-177 PSMA-617 generated USD 1.04 billion in nine-month 2024 sales, validating precision oncology's commercial scale. Cardiology meanwhile benefits from flurpiridaz F-18, which delivers superior sensitivity over legacy SPECT perfusion scans and enables exercise-stress protocols. Procedure growth spreads beyond mature markets as emerging economies integrate nuclear imaging units into tertiary hospitals. Because the same radioisotope infrastructure serves both disease areas, volume expansion produces operating-leverage benefits that reinforce supplier profitability. Ongoing increases in life expectancy and lifestyle-driven risk factors point to sustained high procedure counts through the forecast horizon.
Rapid Adoption of Hybrid PET/CT and SPECT/CT Systems
Hybrid imaging unites functional tracer data with high-resolution anatomical detail in a single exam, improving lesion localization while lowering false-negative rates. PET procedure volumes jumped 12.2% year-on-year in 2024 and average scans per PET/CT system rose 8.2%, signaling both installed-base expansion and higher utilization. Next-generation total-body PET platforms shorten acquisition times to under one minute, cutting tracer dose and boosting patient throughput. SPECT/CT gains detector efficiency from cadmium-zinc-telluride crystals, supporting low-activity protocols that lower pharmacy costs. AI engines embedded in reconstruction software automate organ segmentation and attenuation correction, freeing technologists for higher-value tasks. Hospitals thus view platform upgrades as a route to superior diagnostic accuracy and faster return on capital, accelerating the replacement cycle.
Fragile Mo-99 and Other Isotope Supply Chains
October 2024 maintenance delays at Europe's Petten and Maria reactors cut Mo-99 deliveries by up to 100%, forcing clinics to postpone scans and ration generator activity. U.S. congressional hearings warned the nation remains vulnerable to similar disruptions, given its continuing reliance on imported technetium. While accelerator-based production pilots show promise, they cannot yet replace multi-curie reactor output. Such supply fragility raises procurement costs and complicates scan scheduling, constraining near-term nuclear imaging market growth.
Other drivers and restraints analyzed in the detailed report include:
- Regulatory Approvals of Novel PSMA- and FAPI-Based Tracers
- Government Investments in Isotope-Production Reactors
- High Capital Cost and Patchy Reimbursement
For complete list of drivers and restraints, kindly check the Table Of Contents.
Segment Analysis
SPECT captured 55.78% of the nuclear imaging market share in 2025; PET are forecast to expand at an 8.03% CAGR through 2031. Equipment sales benefit from hybrid upgrade cycles and AI-driven workflow features. Total-body PET platforms, priced at the system premium, enable eyes-to-thigh coverage within minutes, significantly raising department capacity. SPECT/CT gains detector sensitivity improvements that permit pediatric and renal protocols with reduced radiation burden. PET/MRI remains a niche for neuro-oncology research owing to high acquisition costs and integration complexity. Hospitals increasingly co-purchase cyclotrons to secure tracer supply, bundling financing packages that spread capital repayment across equipment, isotope contracts, and software maintenance. Together, these dynamics keep the nuclear imaging market size anchored by radioisotope volume growth even as hardware values advance steadily.
Geography Analysis
North America led the nuclear imaging market with 41.85% share in 2025, supported by the world's largest fleet of PET/CT scanners, robust payor coverage, and a deep pipeline of FDA-cleared tracers. CMS's 2025 radiopharmaceutical payment carve-out above USD 630 removes a key deterrent to high-cost agents, encouraging hospitals to adopt F-18, Ga-68, and Cu-64 tracers for oncology, cardiology, and infection imaging. The U.S. also houses multiple cyclotron clusters and emerging accelerator production trials for Mo-99, aiming to reduce import dependence. Canada contributes specialized isotope production through the McMaster and TRIUMF facilities yet continues to rely on cross-border generator flows after the Chalk River reactor retirement.
Europe ranks second, balancing coordinated health systems with sustained public investment in isotope infrastructure. The EUR 2.2 billion Pallas reactor project secures long-term technetium supply and supports therapeutic isotope diversification. France positions itself at the forefront of alpha-therapy manufacturing via Orano Med's thorium-228 plant, projected to supply 100,000 lead-212 doses annually post-2034. Regulatory agility is on display with U.K. MHRA approval of the first technetium-PSMA product, illustrating a willingness to extend tracer innovation beyond PET-dominant pathways. However, periodic reactor outages and varying national reimbursement tariffs produce patchwork market conditions across the bloc.
Asia-Pacific delivers the fastest regional growth at a 9.05% CAGR through 2031, spurred by large unmet diagnostic needs, rising oncology prevalence, and aggressive government backing for isotope self-sufficiency. China operates nearly 1,200 nuclear imaging departments and aims to double service capacity by 2035 under its medical-isotope development blueprint. Japan blends advanced device engineering with a growing radiopharmaceutical export platform, bolstered by GE HealthCare's takeover of Nihon Medi-Physics. India and South Korea prioritize cyclotron deployments to support burgeoning PET activity and medical-tourism demand. Australia builds redundancy into Mo-99 supply through the ANSTO OPAL reactor. Across the region, regulatory harmonization efforts and workforce-training initiatives seek to keep pace with rapid equipment installation, shaping Asia-Pacific into the next demand engine for the nuclear imaging market.
List of Companies Covered in this Report:
- GE HealthCare Technologies Inc.
- Siemens Healthineers
- Koninklijke Philips
- Canon
- United Imaging Healthcare Co., Ltd.
- Cardinal Health
- Curium Pharma
- Bracco Imaging S.p.A.
- Bayer
- Novartis
- Lantheus
- BWX Technologies Inc. (Nordion)
- Eckert & Ziegler SE
- Jubilant Pharmova Ltd.
- Telix Pharmaceuticals Ltd.
- Clarity Pharmaceuticals Ltd.
- Spectrum Dynamics Medical Inc.
- MiE Medical Imaging Electronics GmbH
- Digirad Corp.
- SOFIE Biosciences Inc.
- Isotope Technologies Garching GmbH
- NTP Radioisotopes
- CMR Naviscan
Additional Benefits:
- The market estimate (ME) sheet in Excel format
- 3 months of analyst support
TABLE OF CONTENTS
1 Introduction
- 1.1 Study Assumptions & Market Definition
- 1.2 Scope of the Study
2 Research Methodology
3 Executive Summary
4 Market Landscape
- 4.1 Market Overview
- 4.2 Market Drivers
- 4.2.1 Rising cancer & CVD incidence
- 4.2.2 Rapid adoption of hybrid PET/CT & SPECT/CT systems
- 4.2.3 Regulatory approvals of novel PSMA- & FAPI-based tracers
- 4.2.4 Government investments in isotope-production reactors
- 4.2.5 Decentralized hospital cyclotrons
- 4.2.6 AI-driven dose- and workflow optimisation
- 4.3 Market Restraints
- 4.3.1 Fragile Mo-99 and other isotope supply chains
- 4.3.2 High capital cost & patchy reimbursement
- 4.3.3 Shortage of certified nuclear-imaging technologists
- 4.3.4 Slow regulatory path for alpha-emitting therapeutics
- 4.4 Value / Supply-Chain Analysis
- 4.5 Regulatory Landscape
- 4.6 Technological Outlook
- 4.7 Porter's Five Forces
- 4.7.1 Threat of New Entrants
- 4.7.2 Bargaining Power of Suppliers
- 4.7.3 Bargaining Power of Buyers
- 4.7.4 Threat of Substitutes
- 4.7.5 Competitive Rivalry
5 Market Size & Growth Forecasts (Value in USD)
- 5.1 By Product
- 5.1.1 Equipment
- 5.1.1.1 PET Scanners
- 5.1.1.2 SPECT Scanners
- 5.1.1 Equipment
- 5.2 By Application
- 5.2.1 SPECT Applications
- 5.2.1.1 Cardiology
- 5.2.1.2 Neurology
- 5.2.1.3 Thyroid
- 5.2.1.4 Other SPECT Applications
- 5.2.2 PET Applications
- 5.2.2.1 Oncology
- 5.2.2.2 Cardiology
- 5.2.2.3 Neurology
- 5.2.2.4 Other PET Applications
- 5.2.1 SPECT Applications
- 5.3 By End User
- 5.3.1 Hospitals
- 5.3.2 Diagnostic Imaging Centres
- 5.3.3 Academic & Research Institutes
- 5.4 By Geography
- 5.4.1 North America
- 5.4.1.1 United States
- 5.4.1.2 Canada
- 5.4.1.3 Mexico
- 5.4.2 Europe
- 5.4.2.1 Germany
- 5.4.2.2 United Kingdom
- 5.4.2.3 France
- 5.4.2.4 Italy
- 5.4.2.5 Spain
- 5.4.2.6 Rest of Europe
- 5.4.3 Asia-Pacific
- 5.4.3.1 China
- 5.4.3.2 India
- 5.4.3.3 Japan
- 5.4.3.4 South Korea
- 5.4.3.5 Australia
- 5.4.3.6 Rest of Asia-Pacific
- 5.4.4 South America
- 5.4.4.1 Brazil
- 5.4.4.2 Argentina
- 5.4.4.3 Rest of South America
- 5.4.5 Middle East and Africa
- 5.4.5.1 GCC
- 5.4.5.2 South Africa
- 5.4.5.3 Rest of Middle East and Africa
- 5.4.1 North America
6 Competitive Landscape
- 6.1 Market Concentration
- 6.2 Market Share Analysis
- 6.3 Company Profiles (includes Global-level Overview, Market-level Overview, Core Segments, Financials as available, Strategic Information, Market Rank/Share for key companies, Products & Services, Recent Developments)
- 6.3.1 GE HealthCare Technologies Inc.
- 6.3.2 Siemens Healthineers AG
- 6.3.3 Koninklijke Philips N.V.
- 6.3.4 Canon Medical Systems Corp.
- 6.3.5 United Imaging Healthcare Co., Ltd.
- 6.3.6 Cardinal Health Inc.
- 6.3.7 Curium Pharma
- 6.3.8 Bracco Imaging S.p.A.
- 6.3.9 Bayer AG
- 6.3.10 Novartis AG (Advanced Accelerator Applications)
- 6.3.11 Lantheus Holdings Inc.
- 6.3.12 BWX Technologies Inc. (Nordion)
- 6.3.13 Eckert & Ziegler SE
- 6.3.14 Jubilant Pharmova Ltd.
- 6.3.15 Telix Pharmaceuticals Ltd.
- 6.3.16 Clarity Pharmaceuticals Ltd.
- 6.3.17 Spectrum Dynamics Medical Inc.
- 6.3.18 MiE Medical Imaging Electronics GmbH
- 6.3.19 Digirad Corp.
- 6.3.20 SOFIE Biosciences Inc.
- 6.3.21 Isotope Technologies Garching GmbH
- 6.3.22 NTP Radioisotopes SOC
- 6.3.23 CMR Naviscan (Gamma Medica Inc.)
7 Market Opportunities & Future Outlook
- 7.1 White-space & Unmet-Need Assessment

