
PUBLISHER: Mordor Intelligence | PRODUCT CODE: 2066399

PUBLISHER: Mordor Intelligence | PRODUCT CODE: 2066399
Asia-Pacific Life And Non-Life Insurance - Market Share Analysis, Industry Trends & Statistics, Growth Forecasts (2026 - 2031)
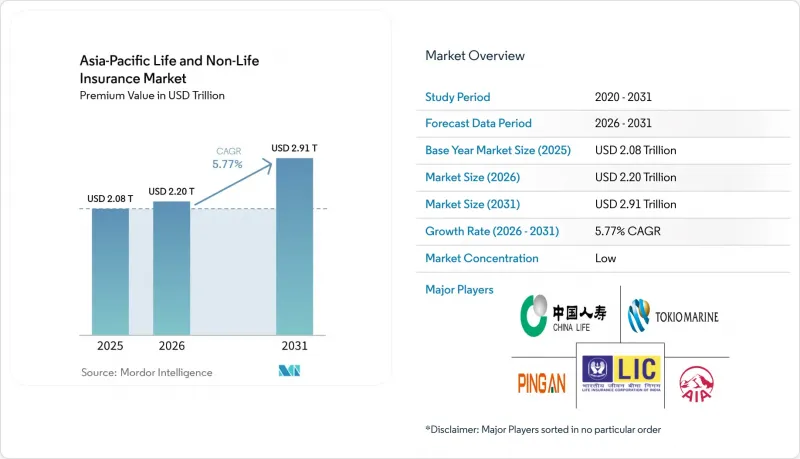
According to Mordor Intelligence, the asia-Pacific life and non-Life insurance market size is projected to be USD 2.08 trillion in 2025, USD 2.20 trillion in 2026, and reach USD 2.91 trillion by 2031, growing at a CAGR of 5.77% from 2026 to 2031.
This report is Segmented by Insurance Type (Life Insurance, Non-Life Insurance (Motor, Health, Property, Liability and More)), Customer Segment (Retail, and Corporate), Distribution Channel (Broker, Agents, Banks, Direct Sales, and Other Channels), and Geography (India, China, Japan, Australia, South Korea, Southeast Asia and More). The Market Forecasts are Provided in Value (USD).
Asia-Pacific Life And Non-Life Insurance Market Trends and Insights
Private Health Insurance Expansion Amid Medical Inflation And Public Scheme Gaps
India's health insurance premiums rose 27.17% year over year in January 2026, supported by a reduction of GST on retail policies from 18% to 5% and stronger Ayushman Bharat uptake that lifted gross written premiums by 37.78%. Aon reported India's 2026 medical trend at 11.5%, higher than the global average, and noted that most consumers are moving to higher coverage limits to manage the costs of chronic conditions and specialty treatments. In China, medical trend rates are projected at 11.1% for 2026, and insurers are pivoting to participating health products with lower guarantees as benchmark rates fell through 2025, aligning product economics with a lower-yield environment while addressing claims inflation. Singapore, Malaysia, and the Philippines face some of the steepest 2026 medical trend rates in the region, with regulators adding cost-sharing through co-payments and deductibles to temper utilization and fraud. Swiss Re estimated Asia's health protection gap at USD 258 billion in premium-equivalent terms as of 2024, signaling significant headroom for private cover, micro-policies, and group schemes to expand access. Policy frameworks like Malaysia's affordable health roadmap and selective delays to co-insurance mandates in Indonesia indicate an ongoing balance between affordability, sustainability, and wider coverage.
Life Protection And Retirement Savings Rebound Under Favorable Rates And Pension Reforms
Japan's life sector is on a 5.4% growth path through 2030, reaching USD 337.7 billion in direct written premiums as yields improved after the 2024 policy shift, lifting credited rates on yen-denominated savings products. China's nationwide voluntary personal pensions, implemented in December 2024 with tax incentives and a favorable withdrawal structure, drew 72.8 million account openings by November 2024, and early corporate adoption signals rising interest in supplemental retirement plans. South Korea proposed raising National Pension Scheme contributions from 9% to 13% starting in 2026 with phased increases, targeting longer fund solvency and an improved income replacement rate. India's pension reforms introduced longer waiting periods for certain withdrawals and a minimum balance rule, while the GST exemption on life and health premiums set in September 2025 supports better affordability and long-term compounding. Demographic aging across Japan and South Korea, together with India's expanding senior cohort, is reinforcing persistent demand for annuities, health riders, and protection-backed savings policies in the Asia-Pacific life and non-life insurance market.
Reinsurance Capacity And Tight Terms Raising NatCat Rates And Deductibles, Pressuring Affordability
Asia-Pacific's USD 73 billion in 2025 disaster losses carried only USD 9 billion in insured payouts, leaving a large uninsured gap that constrains appetite to deploy capacity at price levels that would close the gap quickly. Taiwan's 7.2 magnitude earthquake in April 2024 caused USD 1.3 billion in overall losses with significant business interruption, which drove higher pricing and stricter terms at subsequent renewals relative to markets with benign loss experience. Thailand also saw rate increases after seismic and typhoon activity, even as global reinsurer capital reached record levels by late 2025. The Philippines' property segment is experiencing stronger growth but faces rising claims tied to recurring severe weather, with insurers balancing coverage breadth against affordability pressures. Australia's cyclone pool saw large claim volumes in 2025, yet government-backed capacity helped lower premiums in higher-risk areas compared with the period before the pool's establishment. At January 2026 renewals, softening was evident for many loss-free accounts, but deductibles and co-participations rose, and certain catastrophe-exposed cedants faced flat to double-digit increases, underscoring heterogeneous outcomes within the Asia-Pacific life and non-life insurance market.
Other drivers and restraints analyzed in the detailed report include:
- Motor Exposure Growth And EV-Led Telematics And Usage-Based Pricing Adoption
- Climate And Catastrophe Risk Repricing Lifting Property And Engineering Premiums
- Bancassurance Conduct And Product Rules Curbing Investment-Linked Sales In Select Markets
For complete list of drivers and restraints, kindly check the Table Of Contents.
Segment Analysis
Life insurance held 63.21% of the Asia-Pacific life and non-life insurance market share in 2025, supported by demand for long-term protection, annuities, and savings products in large markets such as China and Japan. The Asia-Pacific life and non-life insurance market size for health insurance is set to grow at a 9.10% CAGR through 2031, as medical inflation, chronic disease prevalence, and regulatory nudges for employer coverage increase both frequency and severity of claims and drive premium expansion. Motor lines are benefitting from higher vehicle sales and EV penetration in China and select ASEAN markets, although claim costs linked to batteries and specialized parts remain a profitability challenge. Property premiums are adjusting in catastrophe-exposed markets, where underwriting discipline and reinsurance structures are steering rate and deductible decisions at renewal. Liability and specialty lines are growing from smaller bases as corporate risk transfer preferences broaden, with adoption aided by broker placement and structured solutions.
Health's outperformance is visible where regulators and employers introduce co-payments, deductibles, and plan redesign to share costs and encourage responsible utilization. India's retail health segment accelerated into 2026 on the back of a tax-cut tailwind and better digital onboarding, while group health renewal pricing has become more granular, incorporating utilization data and benefit caps. Motor insurers across China and India are deploying behavior-based pricing and telematics to differentiate risk and mitigate loss trends as electrification and usage patterns evolve. The Asia-Pacific life and non-life insurance market continues to see product innovation in savings and protection policies as yield environments change, with participating and unit-linked structures gaining share where guaranteed returns were lowered. These shifts point to a more data-driven and modular approach to benefit design through 2031 in both life and non-life portfolios in the Asia-Pacific life and non-life insurance market.
List of Companies Covered in this Report:
- China Life Insurance (Group) Company
- Ping An Insurance (Group) Company of China, Ltd.
- People's Insurance Company of China (PICC)
- Nippon Life Insurance Company
- Dai-ichi Life Holdings, Inc.
- China Pacific Insurance (Group) Co., Ltd. (CPIC)
- AIA Group Limited
- Tokio Marine Holdings, Inc.
- MS&AD Insurance Group Holdings, Inc.
- Sompo Holdings, Inc.
- QBE Insurance Group Limited
- Insurance Australia Group (IAG)
- Suncorp Group Limited
- Life Insurance Corporation of India (LIC)
- HDFC Life Insurance Company Limited
- SBI Life Insurance Company Limited
- ICICI Prudential Life Insurance Company Limited
- Samsung Life Insurance Co., Ltd.
- Hanwha Life Insurance Co., Ltd.
- Cathay Life Insurance Co., Ltd.
- Fubon Life Insurance Co., Ltd.
- Great Eastern Holdings Limited
- Prudential plc (Asia)
- Manulife Asia
- Sun Life Asia
- AXA Asia & Africa
- Chubb Asia Pacific
Additional Benefits:
- The market estimate (ME) sheet in Excel format
- 3 months of analyst support
TABLE OF CONTENTS
1 Introduction
- 1.1 Study Assumptions & Market Definition
- 1.2 Scope of the Study
2 Research Methodology
3 Executive Summary
4 Market Landscape
- 4.1 Market Overview
- 4.2 Market Drivers
- 4.2.1 Private health insurance expansion amid medical inflation and public scheme gaps (China, India, SEA)
- 4.2.2 Life protection and retirement savings rebound under favorable rates and pension reforms
- 4.2.3 Motor exposure growth and EV-led telematics/usage-based pricing adoption
- 4.2.4 Climate and catastrophe risk repricing lifting property and engineering premiums
- 4.2.5 Embedded insurance via super-apps and real-time payments rails scaling micro coverage
- 4.2.6 IFRS 17 and RBC modernization enabling product redesign and data-driven distribution
- 4.3 Market Restraints
- 4.3.1 Reinsurance capacity/tight terms raising NatCat rates and deductibles, pressuring affordability
- 4.3.2 Bancassurance conduct and product rules curbing investment-linked sales in select markets
- 4.3.3 Health claims inflation elevating loss ratios and premium burdens for employers/retail
- 4.3.4 Capital, talent and data-governance frictions under IFRS17/RBC slowing launches at mid-tier carriers
- 4.4 Value / Supply-Chain Analysis
- 4.5 Regulatory Landscape
- 4.6 Technological Outlook
- 4.7 Porter's Five Forces Analysis
- 4.7.1 Threat of New Entrants
- 4.7.2 Bargaining Power of Buyers
- 4.7.3 Bargaining Power of Suppliers
- 4.7.4 Threat of Substitutes
- 4.7.5 Industry Rivalry
5 Market Size & Growth Forecasts (value)
- 5.1 By Insurance Type
- 5.1.1 Life Insurance
- 5.1.2 Non-Life Insurance
- 5.1.2.1 Motor Insurance
- 5.1.2.2 Health Insurance
- 5.1.2.3 Property Insurance
- 5.1.2.4 Liability Insurance
- 5.1.2.5 Other Insurance
- 5.2 By Customer Segment
- 5.2.1 Retail
- 5.2.2 Corporate
- 5.3 By Distribution Channel
- 5.3.1 Brokers
- 5.3.2 Agents
- 5.3.3 Banks
- 5.3.4 Direct Sales
- 5.3.5 Other Channels
- 5.4 By Geography
- 5.4.1 India
- 5.4.2 China
- 5.4.3 Japan
- 5.4.4 Australia
- 5.4.5 South Korea
- 5.4.6 South East Asia (Singapore, Malaysia, Thailand, Indonesia, Vietnam, and Philippines)
- 5.4.7 Rest of Asia-Pacific
6 Competitive Landscape
- 6.1 Market Concentration
- 6.2 Strategic Moves
- 6.3 Market Share Analysis
- 6.4 Company Profiles {(includes Global level Overview, Market level overview, Core Segments, Financials as available, Strategic Information, Market Rank/Share for key companies, Products & Services, and Recent Developments)}
- 6.4.1 China Life Insurance (Group) Company
- 6.4.2 Ping An Insurance (Group) Company of China, Ltd.
- 6.4.3 People's Insurance Company of China (PICC)
- 6.4.4 Nippon Life Insurance Company
- 6.4.5 Dai-ichi Life Holdings, Inc.
- 6.4.6 China Pacific Insurance (Group) Co., Ltd. (CPIC)
- 6.4.7 AIA Group Limited
- 6.4.8 Tokio Marine Holdings, Inc.
- 6.4.9 MS&AD Insurance Group Holdings, Inc.
- 6.4.10 Sompo Holdings, Inc.
- 6.4.11 QBE Insurance Group Limited
- 6.4.12 Insurance Australia Group (IAG)
- 6.4.13 Suncorp Group Limited
- 6.4.14 Life Insurance Corporation of India (LIC)
- 6.4.15 HDFC Life Insurance Company Limited
- 6.4.16 SBI Life Insurance Company Limited
- 6.4.17 ICICI Prudential Life Insurance Company Limited
- 6.4.18 Samsung Life Insurance Co., Ltd.
- 6.4.19 Hanwha Life Insurance Co., Ltd.
- 6.4.20 Cathay Life Insurance Co., Ltd.
- 6.4.21 Fubon Life Insurance Co., Ltd.
- 6.4.22 Great Eastern Holdings Limited
- 6.4.23 Prudential plc (Asia)
- 6.4.24 Manulife Asia
- 6.4.25 Sun Life Asia
- 6.4.26 AXA Asia & Africa
- 6.4.27 Chubb Asia Pacific
7 Market Opportunities & Future Outlook
- 7.1 White-space & unmet-need assessment

