
PUBLISHER: Mordor Intelligence | PRODUCT CODE: 2066419

PUBLISHER: Mordor Intelligence | PRODUCT CODE: 2066419
India Oil and Gas - Market Share Analysis, Industry Trends & Statistics, Growth Forecasts (2026 - 2031)
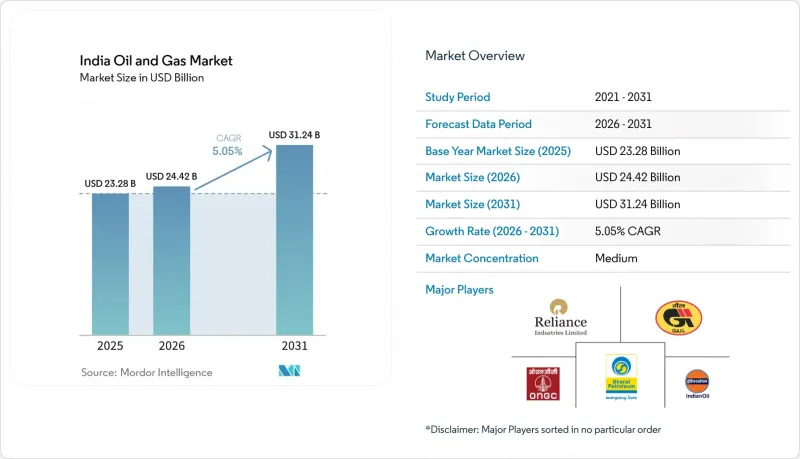
According to Mordor Intelligence, the india oil and gas market size is expected to grow from USD 23.28 billion in 2025 to USD 24.42 billion in 2026 and is forecast to reach USD 31.24 billion by 2031 at 5.05% CAGR over 2026-2031.
This report is Segmented by Sector (Upstream, Midstream, and Downstream), Location (Onshore and Offshore), and Service (Construction, Maintenance and Turn-Around, and Decommissioning). The Market Sizes and Forecasts are Provided in Terms of Value (USD).
India Oil and Gas Market Trends and Insights
Tightening Domestic E&P Licensing Rounds
The Open Acreage Licensing Policy awarded 14 blocks in the OALP-VIII round during 2025, bringing private explorers into basins historically reserved for state-owned firms. Cairn Oil & Gas and other independents now hold interests in 22 exploration blocks, compressing appraisal timelines and encouraging secondary-recovery pilots that raise near-term production. The revenue-sharing fiscal model lowers the government's take when crude prices soften, improving frontier basin economics. Regulators enforce strict work-program milestones, so operators rely on machine-learning seismic tools to finish data acquisition within three-year windows. These developments collectively lift drilling activity and underpin the positive impact on the Indian oil and gas market.
Surge in Gas-Based Industrial Clusters
New methanol-to-olefins and direct-reduced iron facilities added 12 million scm per day of gas demand by 2027, broadening the buyer base beyond legacy fertilizer offtakers. Gujarat's Dahej-Hazira corridor alone locked in 4.2 bcm of annual supply under take-or-pay contracts, sustaining pipeline throughput for. Tamil Nadu's Cuddalore complex will commission a 1.2 Mt ethylene cracker in 2026, absorbing regasified LNG from Ennore and tightening regional balances. A unified tariff cap of INR 70 per MMBtu keeps pipeline transport competitive with naphtha when Brent exceeds USD 70 per barrel. Higher thermal efficiency of gas-fired units relative to coal bolsters environmental compliance for energy-intensive manufacturers.
ESG-Driven Capital Flight from Fossil Assets
Institutional investors divested roughly USD 1.8 billion from Indian fossil equities in 2025 as net-zero mandates took hold. Equity markets had historically supplied one-third of upstream project capital, so private operators now pay 150-200 basis-point spreads above benchmarks to secure debt, eroding project economics. GAIL's USD 2.1 billion Jagdishpur-Haldia pipeline struggled to attract international lenders, pushing the firm toward domestic banks that approach exposure ceilings. ESG screens also constrain midstream and downstream projects because disclosure frameworks force companies to quantify Scope 3 emissions, which positions gas unfavorably for some global funds. The resulting capital scarcity delays final investment decisions and tempers growth in the Indian oil and gas market.
Other drivers and restraints analyzed in the detailed report include:
- Expansion of City-Gas Distribution Networks
- Rising Private Investments in Refinery Upgrades
- Slow Land-Acquisition for Trunk Pipelines Constrains Infrastructure Development
For complete list of drivers and restraints, kindly check the Table Of Contents.
Segment Analysis
Upstream held 69.1% of the Indian oil and gas market revenue in 2025, yet its operating margin fell to 34% as mature fields required more artificial lift, pushing lifting costs to USD 22 per barrel. Downstream refining and petrochemicals expanded at 5.4% a year, and Reliance's FY2025 gross refining margin of USD 11.80 per barrel exceeded the Singapore benchmark by USD 7.30 because 18% of throughput became polymers. Midstream held the balance, but a unified tariff cap limits upside even as volumes grow.
Value capture is shifting: integrated players controlling molecules from the wellhead to the barrel of polymer command higher returns. Petrochemical add-ons boost margins while insulating refineries from motor-fuel cyclicality, making downstream assets increasingly strategic to the Indian oil and gas market. Upstream firms are responding with enhanced-oil-recovery pilots such as Cairn's polymer flood that could add 140 million barrels, mirroring downstream process-optimization philosophies.
List of Companies Covered in this Report:
- Oil and Natural Gas Corporation (ONGC)
- Oil India Limited
- Reliance Industries Ltd.
- Indian Oil Corporation Ltd.
- Bharat Petroleum Corporation Ltd.
- Hindustan Petroleum Corporation Ltd.
- GAIL (India) Ltd.
- Cairn Oil & Gas (Vedanta)
- Petronet LNG Ltd.
- Adani Total Gas Ltd.
- Nayara Energy Ltd.
- ONGC Videsh Ltd.
- Oil and Natural Gas Services (OVL)
- Larsen & Toubro - Hydrocarbon
- Schlumberger India
- Halliburton India
- Baker Hughes India
- Jindal Drilling & Industries Ltd.
- Essar Oil & Gas Exploration & Production
- HPCL-Mittal Energy Ltd.
- Gujarat State Petroleum Corporation (GSPC)
- Numaligarh Refinery Ltd.
- Chennai Petroleum Corporation Ltd.
- Mangalore Refinery & Petrochemicals Ltd.
Additional Benefits:
- The market estimate (ME) sheet in Excel format
- 3 months of analyst support
TABLE OF CONTENTS
1 Introduction
- 1.1 Study Assumptions & Market Definition
- 1.2 Scope of the Study
2 Research Methodology
3 Executive Summary
4 Market Landscape
- 4.1 Market Overview
- 4.2 Market Drivers
- 4.2.1 Tightening domestic E&P licensing rounds
- 4.2.2 Surge in gas-based industrial clusters
- 4.2.3 Expansion of city-gas distribution (CGD) networks
- 4.2.4 Rising private investments in refinery upgrades
- 4.2.5 Digital oil-field adoption for mature basins
- 4.2.6 Methane-slip abatement mandates
- 4.3 Market Restraints
- 4.3.1 Feedstock volatility under Indirect Tax regime
- 4.3.2 Slow land-acquisition for trunk pipelines
- 4.3.3 High breakeven of deep-water prospects
- 4.3.4 ESG-driven capital flight from fossil assets
- 4.4 Supply-Chain Analysis
- 4.5 Regulatory Landscape
- 4.6 Technological Outlook
- 4.7 Crude-Oil Production & Consumption Outlook
- 4.8 Natural-Gas Production & Consumption Outlook
- 4.9 Installed Pipeline Capacity Analysis
- 4.10 Unconventional Resources CAPEX Outlook (tight oil, oil sands, deep-water)
- 4.11 Porter's Five Forces
- 4.11.1 Threat of New Entrants
- 4.11.2 Bargaining Power of Suppliers
- 4.11.3 Bargaining Power of Buyers
- 4.11.4 Threat of Substitutes
- 4.11.5 Intensity of Competitive Rivalry
- 4.12 PESTLE Analysis
5 Market Size & Growth Forecasts
- 5.1 By Sector
- 5.1.1 Upstream
- 5.1.2 Midstream
- 5.1.3 Downstream
- 5.2 By Location
- 5.2.1 Onshore
- 5.2.2 Offshore
- 5.3 By Service
- 5.3.1 Construction
- 5.3.2 Maintenance and Turn-around
- 5.3.3 Decommissioning
6 Competitive Landscape
- 6.1 Market Concentration
- 6.2 Strategic Moves (M&A, Partnerships, PPAs)
- 6.3 Market Share Analysis (Market Rank/Share for key companies)
- 6.4 Company Profiles (includes Global level Overview, Market level overview, Core Segments, Financials as available, Strategic Information, Products & Services, and Recent Developments)
- 6.4.1 Oil and Natural Gas Corporation (ONGC)
- 6.4.2 Oil India Limited
- 6.4.3 Reliance Industries Ltd.
- 6.4.4 Indian Oil Corporation Ltd.
- 6.4.5 Bharat Petroleum Corporation Ltd.
- 6.4.6 Hindustan Petroleum Corporation Ltd.
- 6.4.7 GAIL (India) Ltd.
- 6.4.8 Cairn Oil & Gas (Vedanta)
- 6.4.9 Petronet LNG Ltd.
- 6.4.10 Adani Total Gas Ltd.
- 6.4.11 Nayara Energy Ltd.
- 6.4.12 ONGC Videsh Ltd.
- 6.4.13 Oil and Natural Gas Services (OVL)
- 6.4.14 Larsen & Toubro - Hydrocarbon
- 6.4.15 Schlumberger India
- 6.4.16 Halliburton India
- 6.4.17 Baker Hughes India
- 6.4.18 Jindal Drilling & Industries Ltd.
- 6.4.19 Essar Oil & Gas Exploration & Production
- 6.4.20 HPCL-Mittal Energy Ltd.
- 6.4.21 Gujarat State Petroleum Corporation (GSPC)
- 6.4.22 Numaligarh Refinery Ltd.
- 6.4.23 Chennai Petroleum Corporation Ltd.
- 6.4.24 Mangalore Refinery & Petrochemicals Ltd.
7 Market Opportunities & Future Outlook
- 7.1 White-space & Unmet-need Assessment

