
PUBLISHER: Mordor Intelligence | PRODUCT CODE: 2072544

PUBLISHER: Mordor Intelligence | PRODUCT CODE: 2072544
Asia-Pacific Specialty Fertilizers - Market Share Analysis, Industry Trends & Statistics, Growth Forecasts (2026 - 2031)
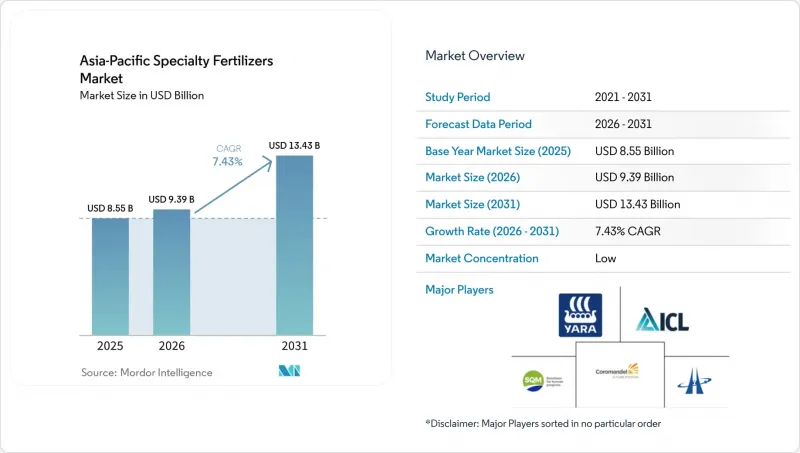
According to Mordor Intelligence, the asia-Pacific specialty fertilizer market size was valued at USD 8.55 billion in 2025 and estimated to grow from USD 9.39 billion in 2026 to reach USD 13.43 billion by 2031, at a CAGR of 7.43% during the forecast period (2026-2031).
This report is Segmented by Specialty Type (CRF, Liquid Fertilizer, SRF, and Water Soluble), by Application Mode (Fertigation, Foliar, Soil), by Crop Type (Field Crops, Horticultural Crops, and Turf and Ornamental), and by Country (Australia, Bangladesh, China, India, Indonesia, Japan, and More). The Market Forecasts are Provided in Terms of Value (USD) and Volume (Metric Tons).
Asia-Pacific Specialty Fertilizers Market Trends and Insights
Precision Fertigation Adoption
Precision fertigation adoption is reshaping the Asia-Pacific specialty fertilizer landscape by creating demand for water-soluble and liquid formulations that integrate seamlessly with automated irrigation systems. China's National Development and Reform Commission allocated USD 2.8 billion in 2024 for water-fertilizer integration projects, targeting 5 million hectares of new fertigation infrastructure by 2027. This policy push reflects the technology's proven ability to reduce fertilizer consumption by 20-30% while increasing crop yields by 15-25% compared to broadcast applications. The economic advantage becomes particularly compelling for high-value crops where fertigation systems can deliver targeted micronutrient blends during critical growth stages, optimizing both plant nutrition and resource utilization.
Government Nutrient-Efficiency Incentives
Government incentive programs across developed Asia-Pacific markets are creating artificial demand premiums for controlled-release and enhanced-efficiency fertilizers through direct subsidies and tax relief mechanisms. Japan's K Program, launched in 2024 with JPY 250 billion (USD 1.68 billion) in funding, designates specialty fertilizers as critical agricultural products eligible for 50% cost-sharing support. This policy intervention effectively eliminates the price premium that historically limited controlled-release fertilizer adoption, creating a structural shift in demand patterns that extends beyond market fundamentals.
High Upfront Product Cost
The 200-400% price premium of specialty fertilizers over conventional NPK creates significant adoption barriers, particularly among smallholder farmers who represent 80% of Asia-Pacific agricultural producers and operate with limited access to credit and risk management tools. Controlled-release urea typically costs USD 800-1,200 per tonne compared to USD 300-400 for conventional urea, requiring farmers to invest 2-3 times more working capital for fertilizer purchases. This cost differential becomes particularly challenging for rice and wheat producers, where commodity prices provide limited margin to absorb input cost increases, creating a structural barrier to adoption that persists despite proven agronomic benefits.
Other drivers and restraints analyzed in the detailed report include:
- Shift to High-Value Horticulture
- Soil Micronutrient Depletion
- Polymer and Potash Price Volatility
For complete list of drivers and restraints, kindly check the Table Of Contents.
Segment Analysis
Liquid fertilizers dominate the Asia-Pacific specialty fertilizer market share, accounting for 54.0% in 2025, driven by their seamless compatibility with precision fertigation systems that are expanding rapidly across the region's intensive agricultural areas. The segment's leadership position reflects the fundamental advantage of liquid formulations in automated application systems where precise nutrient metering and uniform distribution are critical for optimizing crop performance.
Controlled-release fertilizers represent the fastest-growing segment, with a 7.8% CAGR through 2026 to 2031, as environmental regulations and carbon credit programs increasingly favor technologies that reduce nutrient losses and greenhouse gas emissions. The polymer-coated segment within controlled-release fertilizers faces emerging challenges from microplastic regulations, driving innovation toward biodegradable coating materials, including palm stearin, chitosan, and starch-based polymers that maintain release characteristics while addressing environmental concerns
Complete Report Scope:
- Speciality Type
- CRF
- Polymer Coated
- Polymer-Sulfur Coated
- Others
- Liquid Fertilizer
- SRF
- Water Soluble
- CRF
- Application Mode
- Fertigation
- Foliar
- Soil
- Crop Type
- Field Crops
- Horticultural Crops
- Turf & Ornamental
- Country
- Australia
- Bangladesh
- China
- India
- Indonesia
- Japan
- Pakistan
- Philippines
- Thailand
- Vietnam
- Rest of Asia-Pacific
List of Companies Covered in this Report:
- Yara International ASA
- ICL Group Ltd
- Sociedad Quimica y Minera de Chile SA
- Coromandel International Ltd.
- Huaqiang Chemical Group Stock Co., Ltd.
- Haifa Chemicals Ltd
- Compo Expert GmbH (Grupa Azoty S.A.)
- Kingenta Ecological Engineering Group Co. Ltd
- Nutrien Ltd
- Koch Industries Inc
- Hebei Sanyuan Jiuqi Fertilizer Co. Ltd
- Shandong Luxi Chemical Co. Ltd
- Hubei Xinyangfeng Fertilizer Co. Ltd
- Zhongchuang Xingyuan Chemical Technology Co. Ltd
- Zouping Hongyun Biotechnology Co. Ltd
Additional Benefits:
- The market estimate (ME) sheet in Excel format
- 3 months of analyst support
TABLE OF CONTENTS
1 INTRODUCTION
- 1.1 Study Assumptions & Market Definition
- 1.2 Scope of the Study
- 1.3 Research Methodology
2 REPORT OFFERS
3 EXECUTIVE SUMMARY & KEY FINDINGS
4 KEY INDUSTRY TRENDS
- 4.1 Acreage Of Major Crop Types
- 4.1.1 Field Crops
- 4.1.2 Horticultural Crops
- 4.2 Average Nutrient Application Rates
- 4.2.1 Micronutrients
- 4.2.1.1 Field Crops
- 4.2.1.2 Horticultural Crops
- 4.2.2 Primary Nutrients
- 4.2.2.1 Field Crops
- 4.2.2.2 Horticultural Crops
- 4.2.3 Secondary Macronutrients
- 4.2.3.1 Field Crops
- 4.2.3.2 Horticultural Crops
- 4.2.1 Micronutrients
- 4.3 Agricultural Land Equipped For Irrigation
- 4.4 Regulatory Framework
- 4.5 Value Chain & Distribution Channel Analysis
- 4.6 Market Drivers
- 4.6.1 Precision fertigation adoption
- 4.6.2 Government nutrient-efficiency incentives
- 4.6.3 Shift to high-value horticulture
- 4.6.4 Soil micronutrient depletion
- 4.6.5 E-commerce access to niche inputs
- 4.6.6 Carbon-credit backed N?O-reduction demand
- 4.7 Market Restraints
- 4.7.1 High upfront product cost
- 4.7.2 Polymer and potash price volatility
- 4.7.3 Emerging microplastic-coating bans
- 4.7.4 Cold-chain gaps for liquid products
5 MARKET SIZE AND GROWTH FORECASTS (VALUE AND VOLUME)
- 5.1 Speciality Type
- 5.1.1 CRF
- 5.1.1.1 Polymer Coated
- 5.1.1.2 Polymer-Sulfur Coated
- 5.1.1.3 Others
- 5.1.2 Liquid Fertilizer
- 5.1.3 SRF
- 5.1.4 Water Soluble
- 5.1.1 CRF
- 5.2 Application Mode
- 5.2.1 Fertigation
- 5.2.2 Foliar
- 5.2.3 Soil
- 5.3 Crop Type
- 5.3.1 Field Crops
- 5.3.2 Horticultural Crops
- 5.3.3 Turf & Ornamental
- 5.4 Country
- 5.4.1 Australia
- 5.4.2 Bangladesh
- 5.4.3 China
- 5.4.4 India
- 5.4.5 Indonesia
- 5.4.6 Japan
- 5.4.7 Pakistan
- 5.4.8 Philippines
- 5.4.9 Thailand
- 5.4.10 Vietnam
- 5.4.11 Rest of Asia-Pacific
6 COMPETITIVE LANDSCAPE
- 6.1 Key Strategic Moves
- 6.2 Market Share Analysis
- 6.3 Company Landscape
- 6.4 Company Profiles (includes Global Level Overview, Market Level Overview, Core Business Segments, Financials, Headcount, Key Information, Market Rank, Market Share, Products and Services, and Analysis of Recent Developments).
- 6.4.1 Yara International ASA
- 6.4.2 ICL Group Ltd
- 6.4.3 Sociedad Quimica y Minera de Chile SA
- 6.4.4 Coromandel International Ltd.
- 6.4.5 Huaqiang Chemical Group Stock Co., Ltd.
- 6.4.6 Haifa Chemicals Ltd
- 6.4.7 Compo Expert GmbH (Grupa Azoty S.A.)
- 6.4.8 Kingenta Ecological Engineering Group Co. Ltd
- 6.4.9 Nutrien Ltd
- 6.4.10 Koch Industries Inc
- 6.4.11 Hebei Sanyuan Jiuqi Fertilizer Co. Ltd
- 6.4.12 Shandong Luxi Chemical Co. Ltd
- 6.4.13 Hubei Xinyangfeng Fertilizer Co. Ltd
- 6.4.14 Zhongchuang Xingyuan Chemical Technology Co. Ltd
- 6.4.15 Zouping Hongyun Biotechnology Co. Ltd
7 KEY STRATEGIC QUESTIONS FOR FERTILIZERS CEOS

