
PUBLISHER: Mordor Intelligence | PRODUCT CODE: 2073594

PUBLISHER: Mordor Intelligence | PRODUCT CODE: 2073594
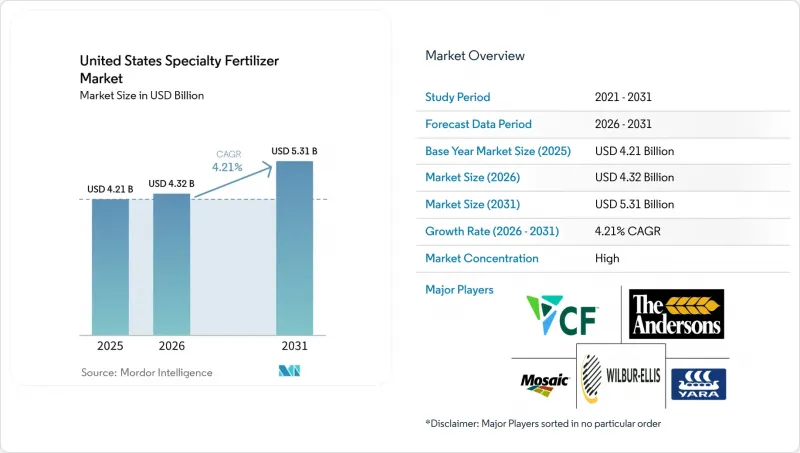
United States Specialty Fertilizer - Market Share Analysis, Industry Trends & Statistics, Growth Forecasts (2026 - 2031)
According to Mordor Intelligence, the united states specialty fertilizer market size is projected to grow from USD 4.21 billion in 2025 to USD 4.32 billion in 2026 and is forecast to reach USD 5.31 billion by 2031 at 4.21% CAGR over 2026-2031.
This report is Segmented by Specialty Type (CRF, Liquid Fertilizer, and More), Application Mode (Fertigation, Foliar, and More), and Crop Type (Field Crops, Horticultural Crops, and More). The Market Forecasts are Provided in Terms of Value (USD) and Volume (Metric Tons).
United States Specialty Fertilizer Market Trends and Insights
Precision Agriculture Adoption Accelerates Demand for High-Efficiency Inputs
Seventy-five percent of corn and soybean acres in leading states used GPS-enabled variable-rate systems in 2024, opening the door for fertilizers that synchronize nutrient release with crop uptake. Growers see 10-15% reductions in application rates without yield loss, which offsets specialty fertilizer premiums. Field sensors, NDVI imagery, and soil conductivity mapping feed real-time prescriptions that lean toward stabilized, polymer-coated, and inhibitor-enhanced formulations. Artificial-intelligence decision tools are now pairing with programmable-release granules able to stagger nutrient availability across a 90-day window. Together, these technologies anchor long-term demand for premium inputs such as specialty fertilizers on high-value acres .
Environmental Rules on Nutrient Runoff Favor Controlled-Release and Soluble Products
Environmental Protection Agency (EPA) total Maximum Daily Load programs in the Chesapeake Bay and other impaired watersheds require a 25% nitrogen reduction by 2025. Compliance pushes growers to products that keep nutrients in the soil profile, such as polymer-coated urea and dual-inhibitor blends. Several Midwest states have expanded voluntary cost-share incentives, while water-quality credit trading programs allow farmers to monetize nutrient savings achieved through the use of enhanced-efficiency fertilizers. The trend favors suppliers able to validate loss reductions with third-party data.
Price Premium Versus Commodity Fertilizers
Specialty fertilizer grades cost 20%-40% more than bulk NPK, leading growers to delay adoption when crop prices fall below USD 4.50 per bushel for corn and USD 12.00 per bushel for soybeans. With margins in commodity systems averaging only 5%-10%, producers remain highly sensitive to input costs. Regional freight charges further widen the price gap, pushing premiums to as high as 50% in remote areas. However, regional blenders introducing generic controlled-release lines have reduced premiums to around 15% where logistics are favorable, though branded suppliers continue to differentiate through superior agronomic service and technical support.
Other drivers and restraints analyzed in the detailed report include:
- Turf and Ornamental Boom Drives Specialty Usage
- Drip, CEA and Vertical-Farm Buildout Needs Soluble, Ultra-Clean Nutrition
- Pending Microplastic Bans on Polymer Coatings
For complete list of drivers and restraints, kindly check the Table Of Contents.
Segment Analysis
Liquid fertilizers held the largest United States specialty fertilizer market share at 38.7% in 2025. These fertilizers are preferred by growers for in-season nitrogen top-dress applications and rapid micronutrient correction. Additionally, water-soluble fertilizers maintain a significant role in fertigation and controlled-environment systems, where their fast dissolution and precise dosing capabilities are essential. Slow-release organo-mineral blends also remain important in turf care, as their extended nutrient availability helps reduce maintenance needs.
Controlled-release fertilizers are anticipated to be the fastest-growing specialty fertilizer type, with a projected CAGR of 6.8% through 2031. This growth is driven by runoff regulations that promote nutrient-delivery technologies capable of extending nutrient availability for 90-120 days. Manufacturers are increasingly incorporating multiple release mechanisms within single granules, enabling early-season soluble nitrogen release followed by temperature-responsive nutrient delivery. Advances in coating technologies, coupled with field trials demonstrating both agronomic and economic benefits, are fostering wider adoption of controlled-release fertilizers across the United States specialty fertilizer market.
Complete Report Scope:
- Speciality Type
- CRF
- Polymer Coated
- Polymer-Sulfur Coated
- Others
- Liquid Fertilizer
- SRF
- Water Soluble
- CRF
- Application Mode
- Fertigation
- Foliar
- Soil
- Crop Type
- Field Crops
- Horticultural Crops
- Turf & Ornamental
List of Companies Covered in this Report:
- Nutrien Ltd.
- The Mosaic Company
- CF Industries Holdings Inc.
- Koch Fertilizer LLC (Koch Industries Inc.)
- Yara International ASA
- ICL Group Ltd.
- Haifa Chemicals Ltd. (Trance-Chem Ltd.)
- Sociedad Qumica y Minera de Chile S.A.
- Wilbur-Ellis Company LLC
- The Andersons Inc.
- J.R. Simplot Company
- Helena Agri-Enterprises LLC (Marubeni Corporation)
- The Scotts Miracle-Gro Company
- COMPO EXPERT GmbH (Grupa Azoty S.A.)
- Agro-Culture Liquid Fertilizers, Inc.
Additional Benefits:
- The market estimate (ME) sheet in Excel format
- 3 months of analyst support
TABLE OF CONTENTS
1 INTRODUCTION
- 1.1 Study Assumptions & Market Definition
- 1.2 Scope of the Study
- 1.3 Research Methodology
2 EXECUTIVE SUMMARY & KEY FINDINGS
3 REPORT OFFERS
4 KEY INDUSTRY TRENDS
- 4.1 Acreage Of Major Crop Types
- 4.1.1 Field Crops
- 4.1.2 Horticultural Crops
- 4.2 Average Nutrient Application Rates
- 4.2.1 Micronutrients
- 4.2.1.1 Field Crops
- 4.2.1.2 Horticultural Crops
- 4.2.2 Primary Nutrients
- 4.2.2.1 Field Crops
- 4.2.2.2 Horticultural Crops
- 4.2.3 Secondary Macronutrients
- 4.2.3.1 Field Crops
- 4.2.3.2 Horticultural Crops
- 4.2.1 Micronutrients
- 4.3 Agricultural Land Equipped For Irrigation
- 4.4 Regulatory Framework
- 4.5 Value Chain & Distribution Channel Analysis
- 4.6 Market Drivers
- 4.6.1 Precision-ag adoption accelerates demand for high-efficiency inputs
- 4.6.2 Environmental rules on nutrient runoff favor controlled-release and soluble products
- 4.6.3 Micro-irrigation expansion boosts fertigation-grade fertilizers
- 4.6.4 Turf-and-ornamental boom drives specialty usage
- 4.6.5 Food-retailer carbon scoring rewards low-loss nitrogen technologies
- 4.6.6 Drip, CEA/vertical-farm build-out needs soluble, ultra-clean nutrition
- 4.7 Market Restraints
- 4.7.1 Price premium versus commodity fertilizers
- 4.7.2 Ammonia and natural-gas price volatility
- 4.7.3 Pending micro-plastic bans on polymer coatings
- 4.7.4 Canada potash-tariff risk inflates potassium specialties
5 MARKET SIZE AND GROWTH FORECASTS (VALUE AND VOLUME)
- 5.1 Speciality Type
- 5.1.1 CRF
- 5.1.1.1 Polymer Coated
- 5.1.1.2 Polymer-Sulfur Coated
- 5.1.1.3 Others
- 5.1.2 Liquid Fertilizer
- 5.1.3 SRF
- 5.1.4 Water Soluble
- 5.1.1 CRF
- 5.2 Application Mode
- 5.2.1 Fertigation
- 5.2.2 Foliar
- 5.2.3 Soil
- 5.3 Crop Type
- 5.3.1 Field Crops
- 5.3.2 Horticultural Crops
- 5.3.3 Turf & Ornamental
6 COMPETITIVE LANDSCAPE
- 6.1 Key Strategic Moves
- 6.2 Market Share Analysis
- 6.3 Company Landscape
- 6.4 Company Profiles (Includes Global Level Overview, Market Level Overview, Core Business Segments, Financials, Headcount, Key Information, Market Rank, Market Share, Products and Services, and Analysis of Recent Developments)
- 6.4.1 Nutrien Ltd.
- 6.4.2 The Mosaic Company
- 6.4.3 CF Industries Holdings Inc.
- 6.4.4 Koch Fertilizer LLC (Koch Industries Inc.)
- 6.4.5 Yara International ASA
- 6.4.6 ICL Group Ltd.
- 6.4.7 Haifa Chemicals Ltd. (Trance-Chem Ltd.)
- 6.4.8 Sociedad Qumica y Minera de Chile S.A.
- 6.4.9 Wilbur-Ellis Company LLC
- 6.4.10 The Andersons Inc.
- 6.4.11 J.R. Simplot Company
- 6.4.12 Helena Agri-Enterprises LLC (Marubeni Corporation)
- 6.4.13 The Scotts Miracle-Gro Company
- 6.4.14 COMPO EXPERT GmbH (Grupa Azoty S.A.)
- 6.4.15 Agro-Culture Liquid Fertilizers, Inc.
7 KEY STRATEGIC QUESTIONS FOR FERTILIZER CEOS

