
PUBLISHER: Mordor Intelligence | PRODUCT CODE: 2073601

PUBLISHER: Mordor Intelligence | PRODUCT CODE: 2073601
Vietnam Specialty Fertilizers - Market Share Analysis, Industry Trends & Statistics, Growth Forecasts (2026 - 2031)
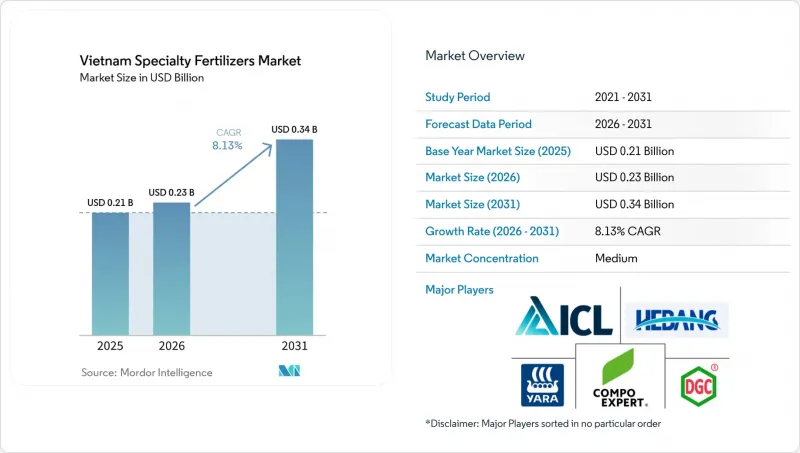
According to Mordor Intelligence, the vietnam specialty fertilizers market size was valued at USD 0.21 billion in 2025 and estimated to grow from USD 0.23 billion in 2026 to reach USD 0.34 billion by 2031, at a CAGR of 8.13% during the forecast period (2026-2031).
This report is Segmented by Specialty Type (CRF, Liquid Fertilizer, SRF, and Water-Soluble), Application Mode (Fertigation, Foliar, and Soil) and Crop Type (Field Crops, Horticultural Crops, and Turf and Ornamental). The Market Forecasts are Provided in Terms of Value (USD) and Volume (Metric Tons).
Vietnam Specialty Fertilizers Market Trends and Insights
Precision-Farming Adoption Boosts Demand for Efficient Inputs
Drone application covered 50,000 hectares of rice in 2024, reducing nutrient costs by up to 25% through variable-rate dosing that relies on digital soil maps. Specialty liquids dissolve evenly and avoid the hopper clogging that restricts drones to low-dust materials. Yara International partnered with PepsiCo on 1,200 hectares of contract potato farms, raising yields 15% and cutting nitrogen runoff 30% in 2024. The government plans to shift 1 million hectares of rice to alternate wetting and drying irrigation by 2030, a system that requires slow-release nitrogen to match water schedules. Soil-mapping programs already cover 2.5 million hectares, equipping agribusinesses with deficiency data that validate premium blends. Adoption will scale in phases because most farms remain below one hectare and depend on cooperative models for capital-intensive technology.
Government VAT Cut Improves Domestic Producer Margins
From July 2025, a 5% VAT replaced the prior 10% rate, shrinking the landed-cost advantage of imports by roughly five percentage points and freeing up local firms to pursue specialty investments. National fertilizer capacity stands near 8 million metric tons compared with demand above 11 million metric tons, so imports will still flow, yet domestic manufacturers now enjoy higher pricing headroom. PetroVietnam Ca Mau earmarked 15% of 2025 capital expenditure for polymer-coated NPK, leveraging its 800,000 metric tons urea base to climb the value chain. Management expects specialty output to rise 10-15% by 2027. The near-term timeline reflects immediate tax savings, while engineering and commissioning of new lines require up to two years.
Volatile Natural-Gas Feedstock Costs
Ammonia prices fell from over USD 700 per metric ton in 2022 to USD 300-400 per metric ton in 2024, underscoring the sensitivity of urea margins to global gas swings. PetroVietnam Ca Mau relies on offshore gas fields whose output has slipped 3-5% each year since 2020, forcing supplemental imports. When feedstock costs spike, producers hesitate to fund specialty upgrades that could turn uneconomic if pricing cannot be passed along to cost-conscious farmers. Imports priced near USD 314 per metric ton from China set a ceiling that domestic suppliers must watch. The short-term timeline highlights immediate pressure during price shocks, although hedging and product-mix shifts can soften the blow.
Other drivers and restraints analyzed in the detailed report include:
- High-Value Crop Export Expansion in Coffee and Pepper
- Rapid Growth of Greenhouse Vegetable Acreage
- Farmer Price Sensitivity Toward Premium Inputs
For complete list of drivers and restraints, kindly check the Table Of Contents.
Segment Analysis
Liquid fertilizers accounted for 49.2% of the Vietnam specialty fertilizers market share in 2025, anchored by greenhouse vegetables, where fertigation delivers nutrients at 150-200 parts per million. Hydroponic growers in Da Lat supply a large share of premium salad greens and report considerable water savings, cementing liquids as the default feed. Limited cold chain infrastructure narrows distribution outside urban zones. Binh Dien's upcoming launch of water-soluble granules offers an alternative that can be stored at ambient temperatures and targets coffee and pepper farms.
Controlled-release fertilizers are anticipated to grow at a CAGR of 4.3% from 2026 to 2031. PetroVietnam Ca Mau's surplus urea enables polymer-coated lines that extend nitrogen release, aligning with coffee and dragon-fruit cycles. Biochar-polyurethane coatings reduce leaching and meet rising organic content rules. Water-soluble products trail liquids in market share but are gaining traction across coffee and pepper farms, where drip systems significantly cut labor. Slow-release sulfur-coated granules grow more slowly because heavy rainfall can trigger uneven nutrient pulses.
Complete Report Scope:
- Speciality Type
- CRF
- Polymer Coated
- Polymer-Sulfur Coated
- Others
- Liquid Fertilizer
- SRF
- Water Soluble
- CRF
- Application Mode
- Fertigation
- Foliar
- Soil
- Crop Type
- Field Crops
- Horticultural Crops
- Turf and Ornamental
List of Companies Covered in this Report:
- PVFCCo (PetroVietnam - Vietnam Oil and Gas Group)
- PetroVietnam Ca Mau Fertilizer - DCM
- Baconco (Hebang Biotechnology Co. Ltd.)
- Binh Dien Fertilizer
- Yara International ASA
- Duc Giang Chemicals Group
- Kingenta Ecological Engineering
- Vietnam National Chemical Group
- Song Gianh Corporation
- Grupa Azoty S.A. (Compo Expert)
- Haifa Group
- Nutrien Ltd.
- ICL Group Ltd.
- Hebei Sanyuanjiuqi Fertilizer Co. Ltd.
Additional Benefits:
- The market estimate (ME) sheet in Excel format
- 3 months of analyst support
TABLE OF CONTENTS
1 INTRODUCTION
- 1.1 Study Assumptions and Market Definition
- 1.2 Scope of the Study
- 1.3 Research Methodology
2 REPORT OFFERS
3 EXECUTIVE SUMMARY AND KEY FINDINGS
4 KEY INDUSTRY TRENDS
- 4.1 Acreage Of Major Crop Types
- 4.1.1 Field Crops
- 4.1.2 Horticultural Crops
- 4.2 Average Nutrient Application Rates
- 4.2.1 Micronutrients
- 4.2.1.1 Field Crops
- 4.2.1.2 Horticultural Crops
- 4.2.2 Primary Nutrients
- 4.2.2.1 Field Crops
- 4.2.2.2 Horticultural Crops
- 4.2.3 Secondary Macronutrients
- 4.2.3.1 Field Crops
- 4.2.3.2 Horticultural Crops
- 4.2.1 Micronutrients
- 4.3 Agricultural Land Equipped For Irrigation
- 4.4 Regulatory Framework
- 4.5 Value Chain and Distribution Channel Analysis
- 4.6 Market Drivers
- 4.6.1 Precision-farming adoption boosts demand for efficient inputs
- 4.6.2 Government VAT change (5 %) improves domestic producer margins
- 4.6.3 High-value crop export expansion
- 4.6.4 Rapid growth of greenhouse vegetable acreage
- 4.6.5 Surplus urea capacity enables coated-urea value-added lines
- 4.6.6 Dutch manure-granulate imports accelerate organic blends
- 4.7 Market Restraints
- 4.7.1 Volatile natural-gas feedstock costs
- 4.7.2 Farmer price-sensitivity toward premium inputs
- 4.7.3 Proliferation of counterfeit / sub-standard products
- 4.7.4 Limited cold-chain for microbial and liquid specialties
5 MARKET SIZE AND GROWTH FORECASTS (VALUE AND VOLUME)
- 5.1 Speciality Type
- 5.1.1 CRF
- 5.1.1.1 Polymer Coated
- 5.1.1.2 Polymer-Sulfur Coated
- 5.1.1.3 Others
- 5.1.2 Liquid Fertilizer
- 5.1.3 SRF
- 5.1.4 Water Soluble
- 5.1.1 CRF
- 5.2 Application Mode
- 5.2.1 Fertigation
- 5.2.2 Foliar
- 5.2.3 Soil
- 5.3 Crop Type
- 5.3.1 Field Crops
- 5.3.2 Horticultural Crops
- 5.3.3 Turf and Ornamental
6 COMPETITIVE LANDSCAPE
- 6.1 Key Strategic Moves
- 6.2 Market Share Analysis
- 6.3 Company Landscape
- 6.4 Company Profiles (includes Global level Overview, Market level overview, Core Segments, Financials as available, Strategic Information, Market Rank/Share for key companies, Products and Services, and Recent Developments)
- 6.4.1 PVFCCo (PetroVietnam - Vietnam Oil and Gas Group)
- 6.4.2 PetroVietnam Ca Mau Fertilizer - DCM
- 6.4.3 Baconco (Hebang Biotechnology Co. Ltd.)
- 6.4.4 Binh Dien Fertilizer
- 6.4.5 Yara International ASA
- 6.4.6 Duc Giang Chemicals Group
- 6.4.7 Kingenta Ecological Engineering
- 6.4.8 Vietnam National Chemical Group
- 6.4.9 Song Gianh Corporation
- 6.4.10 Grupa Azoty S.A. (Compo Expert)
- 6.4.11 Haifa Group
- 6.4.12 Nutrien Ltd.
- 6.4.13 ICL Group Ltd.
- 6.4.14 Hebei Sanyuanjiuqi Fertilizer Co. Ltd.
7 KEY STRATEGIC QUESTIONS FOR FERTILIZER CEOS

