
PUBLISHER: Mordor Intelligence | PRODUCT CODE: 2073577

PUBLISHER: Mordor Intelligence | PRODUCT CODE: 2073577
E-Commerce - Market Share Analysis, Industry Trends & Statistics, Growth Forecasts (2026 - 2031)
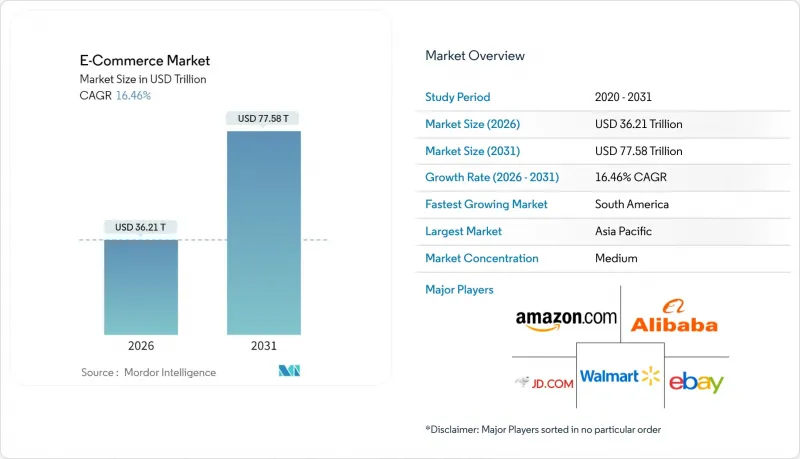
According to Mordor Intelligence, the e-commerce market size stands at USD 36.21 trillion in 2026 and is projected to reach USD 77.58 trillion by 2031, expanding at a 16.46% CAGR.
This report is Segmented by Business Model (B2C, and B2B), Device Type (Smartphone / Mobile, Desktop and Laptop, and More), Payment Method (Credit / Debit Cards, Digital Wallets, BNPL, and More), B2C Product Category (Beauty and Personal Care, Consumer Electronics, Fashion and Apparel, Food and Beverages, and More) and Geography (North America, and More). The Market Forecasts are Provided in Terms of Value (USD).
Global E-Commerce Market Trends and Insights
Accelerating Mobile-Internet and 5G Adoption
Global mobile-internet subscriptions reached 5.6 billion in 2025, and 5G now covers 40% of the population. Latency has fallen below 10 milliseconds, enabling real-time augmented-reality try-ons that convert 30% better than static pages. Standalone 5G cores in India and Indonesia are helping rural merchants list inventory without fixed broadband. Southeast Asia's mobile-only users expect same-day delivery, pressuring logistics providers to match urban service levels. The e-commerce market is therefore shifting infrastructure budgets toward edge nodes and micro-fulfillment centers.
Rising Middle-Class Purchasing Power
Asia-Pacific added 70% of the 150 million new middle-class households formed between 2020 and 2025. Disposable income growth in India, Vietnam, and the Philippines is steering spending toward discretionary categories with higher average order values. Platforms are localizing language interfaces and maintaining cash-on-delivery options where credit penetration is low. Customer acquisition costs in these markets are one-tenth those in mature economies, supporting aggressive subsidy strategies. As a result, the e-commerce market enjoys durable demand tailwinds that offset saturation elsewhere.
Escalating Cyber-Security and Fraud Risks
Ransomware incidents doubled between 2023 and 2025, with remediation costs topping USD 200 million. Payment fraud reached USD 38 billion in 2024. The EU's Digital Operational Resilience Act, effective January 2025, mandates 24-hour breach reporting and fines of up to 2% of global revenue. Smaller merchants face disproportionate compliance costs, prompting migration to managed platforms. This consolidation raises entry barriers in the e-commerce market.
Other drivers and restraints analyzed in the detailed report include:
- Expansion of Digital Wallets and Embedded Finance
- Generative-AI-Powered Personalized Merchandising
- Cross-Border Regulatory and Tax Complexity
For complete list of drivers and restraints, kindly check the Table Of Contents.
Segment Analysis
B2C accounted for 54.89% of the e-commerce market share in 2025, but B2B transactions are growing faster at a 17.43% CAGR. Alibaba's 1688.com processed USD 1.2 trillion in B2B orders in 2024. Larger average order values and embedded credit terms enhance unit economics.
B2C channels continue to benefit from social-commerce integration, yet growth in saturated markets relies on delivery speed and personalization rather than customer acquisition. Consequently, platform operators view digitizing industrial supplies, healthcare procurement, and foodservice distribution as the next revenue frontier in the e-commerce market.
Smartphones captured 72.67% of transactions in 2025, expanding at an 18.17% CAGR. TikTok Shop's mobile-native design delivered USD 20 billion in U.S. gross merchandise value in 2024. Biometric authentication has cut checkout abandonment by 25%.
Desktop usage remains relevant for high-ticket B2B purchases, yet voice-activated reorders via smart speakers are gaining ground. Platforms optimizing latency and one-tap checkout across mobile apps will secure enduring competitive advantage in the e-commerce market.
Complete Report Scope:
- By Business Model
- B2C
- B2B
- By Device Type (B2C)
- Smartphone / Mobile
- Desktop and Laptop
- Other Device Types
- By Payment Method (B2C)
- Credit / Debit Cards
- Digital Wallets
- BNPL
- Other Payment Methods
- By Product Category (B2C)
- Beauty and Personal Care
- Consumer Electronics
- Fashion and Apparel
- Food and Beverages
- Furniture and Home
- Toys, DIY and Media
- Other Product Categories
- By Geography
- North America
- United States
- Canada
- Mexico
- Europe
- Germany
- United Kingdom
- France
- Spain
- Italy
- Netherlands
- Russia
- Rest of Europe
- Asia Pacific
- China
- Japan
- India
- South Korea
- Indonesia
- Thailand
- Malaysia
- Rest of Asia Pacific
- South America
- Brazil
- Argentina
- Chile
- Rest of South America
- Middle East
- United Arab Emirates
- Saudi Arabia
- Turkey
- Israel
- Rest of Middle East
- Africa
- South Africa
- Nigeria
- Kenya
- Egypt
- Rest of Africa
- North America
Geography Analysis
Asia-Pacific generated 54.46% of global revenue in 2025, with China's USD 2.8 trillion and India's USD 350 billion e-commerce bases underpinned by UPI's 131 billion transactions in 2024. South America, led by Brazil, is the fastest-growing region at an 18.12% CAGR, as Pix lowered checkout friction and MercadoLibre expanded logistics coverage.
North America and Europe remain sizeable markets, advancing above 14% annually as same-day delivery networks and subscription models deepen engagement. The Middle East is scaling rapidly, with UAE and Saudi Arabia offering duty-free e-commerce zones and cash-on-delivery support that cater to local preferences.
Africa shows the highest latent potential; mobile money ubiquity, epitomized by M-Pesa, offsets low banking penetration. Jumia and Konga are building fulfillment networks despite currency volatility and infrastructure gaps. Companies able to solve logistics constraints will unlock the next wave of e-commerce market growth on the continent.
- Amazon.com Inc.
- Alibaba Group Holding Ltd.
- Walmart Inc.
- JD.com Inc.
- eBay Inc.
- Shopify Inc.
- Rakuten Group Inc.
- MercadoLibre Inc.
- Sea Ltd. (Shopee)
- Zalando SE
- Flipkart Internet Pvt. Ltd.
- ByteDance Ltd. (TikTok Shop)
- Coupang Inc.
- Otto Group
- Pinduoduo Inc.
- Etsy Inc.
- ASOS plc
- Best Buy Co. Inc.
- Inter IKEA Systems B.V.
- Wayfair Inc.
- Noon eCommerce Platform
- Jumia Technologies AG
- Konga Online Shopping Ltd.
- Lazada Group
Additional Benefits:
- The market estimate (ME) sheet in Excel format
- 3 months of analyst support
TABLE OF CONTENTS
1 INTRODUCTION
- 1.1 Study Assumptions and Market Definition
- 1.2 Scope of the Study
2 RESEARCH METHODOLOGY
3 EXECUTIVE SUMMARY
4 MARKET LANDSCAPE
- 4.1 Market Overview
- 4.2 Market Drivers
- 4.2.1 Accelerating Mobile-Internet and 5G Adoption
- 4.2.2 Rising Middle-Class Purchasing Power
- 4.2.3 Expansion of Digital Wallets and Embedded Finance
- 4.2.4 Generative-AI-Powered Personalised Merchandising
- 4.2.5 Direct-to-Avatar and Virtual Goods Commerce Boom
- 4.2.6 Commerce-as-a-Service Platforms Enabling Brand-Owned Channels
- 4.3 Market Restraints
- 4.3.1 Escalating Cyber-Security and Fraud Risks
- 4.3.2 Cross-Border Regulatory and Tax Complexity
- 4.3.3 Sustainability-Linked Delivery Surcharges
- 4.3.4 Cookie-Deprecation Disrupting Ad Targeting
- 4.4 Industry Value Chain Analysis
- 4.5 Regulatory Landscape
- 4.6 Technological Outlook
- 4.7 Porter's Five Forces Analysis
- 4.7.1 Bargaining Power of Suppliers
- 4.7.2 Bargaining Power of Buyers
- 4.7.3 Threat of New Entrants
- 4.7.4 Threat of Substitutes
- 4.7.5 Competitive Rivalry
- 4.8 Impact of Macroeconomic Factors on the Market
- 4.9 Demographic Analysis (Population, Internet, Age, Income)
- 4.10 Cross-Border E-Commerce Size and Trends
- 4.11 Current Positioning of Key Regions in the E-Commerce Industry
5 MARKET SIZE AND GROWTH FORECASTS (VALUE)
- 5.1 By Business Model
- 5.1.1 B2C
- 5.1.2 B2B
- 5.2 By Device Type (B2C)
- 5.2.1 Smartphone / Mobile
- 5.2.2 Desktop and Laptop
- 5.2.3 Other Device Types
- 5.3 By Payment Method (B2C)
- 5.3.1 Credit / Debit Cards
- 5.3.2 Digital Wallets
- 5.3.3 BNPL
- 5.3.4 Other Payment Methods
- 5.4 By Product Category (B2C)
- 5.4.1 Beauty and Personal Care
- 5.4.2 Consumer Electronics
- 5.4.3 Fashion and Apparel
- 5.4.4 Food and Beverages
- 5.4.5 Furniture and Home
- 5.4.6 Toys, DIY and Media
- 5.4.7 Other Product Categories
- 5.5 By Geography
- 5.5.1 North America
- 5.5.1.1 United States
- 5.5.1.2 Canada
- 5.5.1.3 Mexico
- 5.5.2 Europe
- 5.5.2.1 Germany
- 5.5.2.2 United Kingdom
- 5.5.2.3 France
- 5.5.2.4 Spain
- 5.5.2.5 Italy
- 5.5.2.6 Netherlands
- 5.5.2.7 Russia
- 5.5.2.8 Rest of Europe
- 5.5.3 Asia Pacific
- 5.5.3.1 China
- 5.5.3.2 Japan
- 5.5.3.3 India
- 5.5.3.4 South Korea
- 5.5.3.5 Indonesia
- 5.5.3.6 Thailand
- 5.5.3.7 Malaysia
- 5.5.3.8 Rest of Asia Pacific
- 5.5.4 South America
- 5.5.4.1 Brazil
- 5.5.4.2 Argentina
- 5.5.4.3 Chile
- 5.5.4.4 Rest of South America
- 5.5.5 Middle East
- 5.5.5.1 United Arab Emirates
- 5.5.5.2 Saudi Arabia
- 5.5.5.3 Turkey
- 5.5.5.4 Israel
- 5.5.5.5 Rest of Middle East
- 5.5.6 Africa
- 5.5.6.1 South Africa
- 5.5.6.2 Nigeria
- 5.5.6.3 Kenya
- 5.5.6.4 Egypt
- 5.5.6.5 Rest of Africa
- 5.5.1 North America
6 COMPETITIVE LANDSCAPE
- 6.1 Market Concentration
- 6.2 Strategic Moves
- 6.3 Market Share Analysis
- 6.4 Company Profiles (includes Global level Overview, Market level overview, Core Segments, Financials as available, Strategic Information, Market Rank/Share for key companies, Products and Services, and Recent Developments)
- 6.4.1 Amazon.com Inc.
- 6.4.2 Alibaba Group Holding Ltd.
- 6.4.3 Walmart Inc.
- 6.4.4 JD.com Inc.
- 6.4.5 eBay Inc.
- 6.4.6 Shopify Inc.
- 6.4.7 Rakuten Group Inc.
- 6.4.8 MercadoLibre Inc.
- 6.4.9 Sea Ltd. (Shopee)
- 6.4.10 Zalando SE
- 6.4.11 Flipkart Internet Pvt. Ltd.
- 6.4.12 ByteDance Ltd. (TikTok Shop)
- 6.4.13 Coupang Inc.
- 6.4.14 Otto Group
- 6.4.15 Pinduoduo Inc.
- 6.4.16 Etsy Inc.
- 6.4.17 ASOS plc
- 6.4.18 Best Buy Co. Inc.
- 6.4.19 Inter IKEA Systems B.V.
- 6.4.20 Wayfair Inc.
- 6.4.21 Noon eCommerce Platform
- 6.4.22 Jumia Technologies AG
- 6.4.23 Konga Online Shopping Ltd.
- 6.4.24 Lazada Group
7 MARKET OPPORTUNITIES AND FUTURE OUTLOOK
- 7.1 White-Space and Unmet-Need Assessment

