PUBLISHER: Mordor Intelligence | PRODUCT CODE: 2113608

PUBLISHER: Mordor Intelligence | PRODUCT CODE: 2113608
United States Water Treatment Chemicals - Market Share Analysis, Industry Trends & Statistics, Growth Forecasts (2026 - 2031)
According to Mordor Intelligence, the United States water treatment chemicals market size was valued at USD 5.48 billion in 2025 and estimated to grow from USD 5.79 billion in 2026 to reach USD 7.67 billion by 2031, at a CAGR of 5.73% during the forecast period (2026-2031).
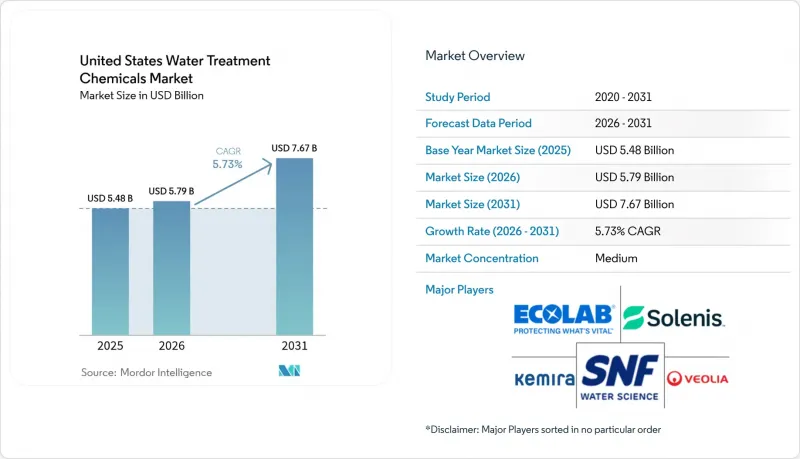
This report is Segmented by Product Type (Biocides and Disinfectants, Coagulants and Flocculants, Corrosion and Scale Inhibitors, and More), End-User Industry (Power, Oil and Gas, Chemical Manufacturing, Mining and Mineral Processing, Municipal, Food and Beverage, and More), and Geography (Northeast, Midwest, South, and West). The Market Forecasts are Provided in Terms of Value (USD).
United States Water Treatment Chemicals Market Trends and Insights
Federal PFAS and Lead-pipe Funding Surge
A USD 15 billion federal grant pool targeted at PFAS cleanup and legacy service-line replacement drives a pronounced increase in demand for enhanced-coagulation blends, corrosion inhibitors, and granular activated carbon (GAC) regenerants. Smaller utilities lacking capital for advanced membranes deploy high-charge aluminum and ferric formulations because these options offer the lowest lifecycle cost for sub-nanogram PFAS removal. Simultaneously, projects replacing aged lead lines rely on phosphate-based corrosion control agents to curb lead solubility during excavation. The bulk of awards is allocated to Midwestern and Northeastern cities, which were built on 19th-century infrastructure, creating a multiyear backlog of chemical requisitions tightly linked to grant disbursement schedules. Suppliers with in-house toxicology and regulatory support win a larger share because they navigate EPA reporting and product registration steps more efficiently.
Industrial Water-reuse Expansion
California's statewide rule requires industrial sites that consume over 1 million gallons per month to meet a 30% recycled-water threshold by 2030, thereby increasing demand for antiscalants, biocides, and cleaning formulations compatible with multiple reuse loops. Semiconductor fabs in Arizona and the evolving petrochemical complexes along the Gulf rely on ultrapure water (UPW) trains that feature ion-exchange regeneration, high-purity acids, and micro-biocides to protect wafer yields. Produced-water recycling in shale plays gains traction as disposal fees exceed USD 3 per barrel, spurring the uptake of high-temperature scale inhibitors and broad-spectrum oxidants that can withstand 150,000 ppm salinity. Food and beverage plants are adding closed-loop CIP systems to counter rising municipal surcharges, which now surpass USD 15 per thousand gallons in drought-stressed counties.
Escalating Raw-Material and Energy Costs
Hydrochloric acid and caustic soda values rose in 2024, driven by higher natural-gas benchmarks and logistics bottlenecks, which crimped producer gross margins. Chlor-alkali units along the Gulf cut utilization during hurricane-related power disruptions, amplifying spot shortages. Municipal bid cycles, often locked a year in advance, left suppliers exposed to cost spikes they could not pass through. Smaller distributors serving rural plants faced greater pain because diesel surcharges added 8-12% to delivered pricing, yet consumption volumes stayed fixed. Larger players offset some of the impact by switching to rail and barge routes and by flexing their integrated chlorine and vinyl value chains.
Other drivers and restraints analyzed in the detailed report include:
- Membrane-Pretreatment Chemicals Adoption
- EPA PFAS Discharge Limits
- Shift to Chemical-Free Technologies
For complete list of drivers and restraints, kindly check the Table Of Contents.
Segment Analysis
Coagulants and flocculants accounted for 31.85% of the United States' water treatment chemicals market share in 2025, driven by their indispensable role during primary clarification across both municipal and industrial basins. Spending on aluminum-based and polyferric blends remains stable because every gallon of raw water requires baseline particle removal, yet volume growth mirrors population growth rather than surging. Biocides and disinfectants, by contrast, record a 6.08% CAGR, the fastest among all categories. PFAS discharge limits, tighter pathogen count thresholds, and more complex membrane trains each require specialized broad-spectrum oxidants and non-oxidizing formulations. Premium corrosion and scale inhibitors post mid-single-digit growth as lead service line replacements surge. pH adjusters and softeners confront commodity pressure: caustic soda spot volatility erodes margins, yet consistent demand from power and pulp segments sustains baseline volume. Defoamers grow off a smaller base as biological systems proliferate, particularly in industrial digesters where surface tension imbalances drive foaming incidents. Specialty polymers, ion-exchange resins, and niche additives grouped under "other product types" capture semiconductor and pharmaceutical buyers willing to pay three to four times the price per pound in exchange for ppb-level purity. Digital dosing reshapes procurement logic. Buyers evaluate chemical supply through a performance lens - verified residual control, minimal sludge, and extended membrane life - rather than pounds delivered. Vendors that couple real-time telemetry with chemical packages gain share despite charging a 20-30% price premium, reinforcing an industry pivot from volume to value.
Complete Report Scope:
- By Product Type
- Biocides and Disinfectants
- Coagulants and Flocculants
- Corrosion and Scale Inhibitors
- Defoamers and Defoaming Agents
- pH Adjusters and Softeners
- Other Product Types
- By End-user Industry
- Power
- Oil and Gas
- Chemical Manufacturing
- Mining and Mineral Processing
- Municipal
- Food and Beverage
- Pulp and Paper
- Other End-user Industries
- By Geography
- Northeast
- Midwest
- South
- West
List of Companies Covered in this Report:
- Albemarle Corporation
- BASF SE
- Buckman Laboratories Inc.
- Calgon Carbon Corporation
- Calgon Carbon Corporation
- Chemtrade
- ChemTreat Inc.
- Dow
- Ecolab
- Kemira
- Kurita Water Industries Ltd.
- Lenntech B.V.
- Nouryon
- SNF
- Solenis
- Solvay
- USALCO
- Veolia
Additional Benefits:
- The market estimate (ME) sheet in Excel format
- 3 months of analyst support
TABLE OF CONTENTS
1 Introduction
- 1.1 Study Assumptions and Market Definition
- 1.2 Scope of the Study
2 Research Methodology
3 Executive Summary
4 Market Landscape
- 4.1 Market Overview
- 4.2 Market Drivers
- 4.2.1 Federal PFAS and Lead-pipe funding surge
- 4.2.2 Industrial water-reuse expansion
- 4.2.3 Membrane-pretreatment chemicals adoption
- 4.2.4 EPA PFAS discharge limits
- 4.2.5 Digital dosing and sensor-linked chemistries
- 4.3 Market Restraints
- 4.3.1 Escalating raw-material and energy costs
- 4.3.2 Shift to chemical-free technologies
- 4.3.3 By-product toxicity regulations on biocides
- 4.4 Value Chain Analysis
- 4.5 Regulatory Landscape
- 4.6 Porter's Five Forces Analysis
- 4.6.1 Bargaining Power of Suppliers
- 4.6.2 Bargaining Power of Consumers
- 4.6.3 Threat of New Entrants
- 4.6.4 Threat of Substitute Products and Services
- 4.6.5 Degree of Competition
5 Market Size and Growth Forecasts (Value)
- 5.1 By Product Type
- 5.1.1 Biocides and Disinfectants
- 5.1.2 Coagulants and Flocculants
- 5.1.3 Corrosion and Scale Inhibitors
- 5.1.4 Defoamers and Defoaming Agents
- 5.1.5 pH Adjusters and Softeners
- 5.1.6 Other Product Types
- 5.2 By End-user Industry
- 5.2.1 Power
- 5.2.2 Oil and Gas
- 5.2.3 Chemical Manufacturing
- 5.2.4 Mining and Mineral Processing
- 5.2.5 Municipal
- 5.2.6 Food and Beverage
- 5.2.7 Pulp and Paper
- 5.2.8 Other End-user Industries
- 5.3 By Geography
- 5.3.1 Northeast
- 5.3.2 Midwest
- 5.3.3 South
- 5.3.4 West
6 Competitive Landscape
- 6.1 Market Concentration
- 6.2 Strategic Moves
- 6.3 Market Share(%)/Ranking Analysis
- 6.4 Company Profiles (includes Global level Overview, Market level overview, Core Segments, Financials as available, Strategic Information, Market Rank/Share for key companies, Products and Services, and Recent Developments)
- 6.4.1 Albemarle Corporation
- 6.4.2 BASF SE
- 6.4.3 Buckman Laboratories Inc.
- 6.4.4 Calgon Carbon Corporation
- 6.4.5 Calgon Carbon Corporation
- 6.4.6 Chemtrade
- 6.4.7 ChemTreat Inc.
- 6.4.8 Dow
- 6.4.9 Ecolab
- 6.4.10 Kemira
- 6.4.11 Kurita Water Industries Ltd.
- 6.4.12 Lenntech B.V.
- 6.4.13 Nouryon
- 6.4.14 SNF
- 6.4.15 Solenis
- 6.4.16 Solvay
- 6.4.17 USALCO
- 6.4.18 Veolia
7 Market Opportunities and Future Outlook
- 7.1 White-space and Unmet-need Assessment

