PUBLISHER: Mordor Intelligence | PRODUCT CODE: 2116710

PUBLISHER: Mordor Intelligence | PRODUCT CODE: 2116710
Japan Computed Tomography - Market Share Analysis, Industry Trends & Statistics, Growth Forecasts (2026 - 2031)
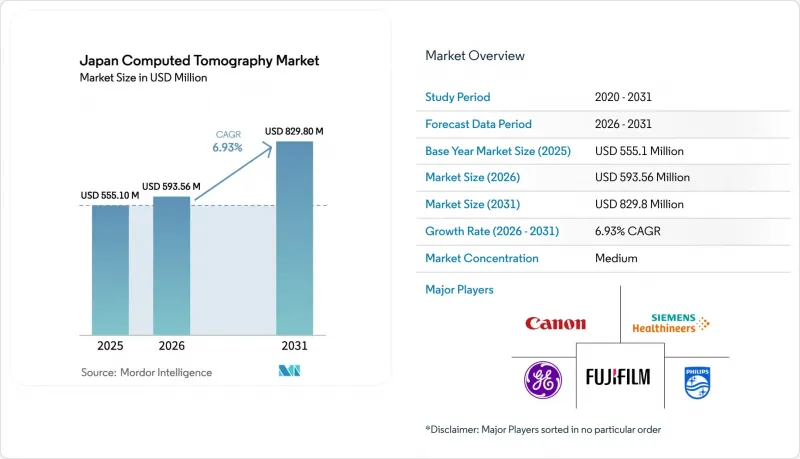
According to Mordor Intelligence, the Japan computed tomography market size in 2026 is estimated at USD 593.56 million, growing from 2025 value of USD 555.1 million with 2031 projections showing USD 829.8 million, growing at 6.93% CAGR over 2026-2031.
This report is Segmented by Type (Low Slice, Medium Slice, and High Slice), Application (Oncology, Neurology, Cardiovascular, Musculoskeletal, and Other Applications), End User (Hospitals, Diagnostic Centers, and Other End Users). The Report Offers the Value (in USD Million) for the Above Segments.
Japan Computed Tomography Market Trends and Insights
Rapid adoption of photon-counting CT in academic centers
Academic hospitals validate photon-counting CT by showcasing sub-0.2 mm isotropic resolution and intrinsic spectral outputs that elevate lung-nodule characterization and coronary-plaque analysis. Early adopters such as Osaka University leverage the Siemens NAEOTOM Alpha platform to publish peer-reviewed evidence supporting radiation-dose cuts of 30-40% while sustaining diagnostic confidence. Local R&D partnerships accelerate domestic prototypes using cadmium-zinc-telluride detectors that address national supply-chain resilience priorities. As clinical protocols mature, procurement committees in tertiary hospitals replicate these benchmarks, expanding addressable volumes across the Japan computed tomography market.
Ageing population-driven oncologic imaging demand
Cancer incidence peaks in the seventh and eighth decades, mirroring Japan's demographic curve. National CT-based lung-cancer screening iterations are entrenched and collectively deliver several hundred-thousand annual examinations that anchor one-third of total scan volume. AI-reconstruction algorithms lower dose per scan, mitigating cumulative exposure anxieties among older patients. Health-economic models demonstrate system-wide savings when early detection defers late-stage chemotherapy costs, ensuring durable policy backing.
High capital outlay amid declining scan fees
List prices range from USD 300,000 for 16-slice models to beyond USD 5 million for photon-counting flagships, straining budgets when Social Insurance Medical Council updates have trimmed CT scan tariffs by 2% annually since 2024. Smaller community hospitals therefore favor leasing or pay-per-scan agreements, moderating total equipment revenue growth.
Other drivers and restraints analyzed in the detailed report include:
- Disaster-preparedness funding for mobile CT fleets
- Reimbursement incentives for AI-enabled low-dose protocols
- Shortage of radiologic technologists in rural prefectures
For complete list of drivers and restraints, kindly check the Table Of Contents.
Segment Analysis
Mid-End 64-slice scanners retained 45.62% of 2025 revenue because they satisfy bread-and-butter oncology and trauma protocols at manageable ownership costs. The Japan computed tomography market size for this tier is projected to expand at 5.05% through 2031 as iterative reconstruction keeps them dose-competitive. High-slice (>128) installations, while only 18% of unit shipments in 2024, capture the prestige segment and are forecast to add USD 97 million by 2031, reflecting a 6.12% CAGR tied to photon-counting launches. Vendor roadmaps indicate detector-module backward-compatibility that lets facilities upgrade piecemeal, elongating replacement cycles yet boosting software revenue streams.
Clinical consensus increasingly favors spectral capabilities, nudging even mid-slice buyers to consider dual-energy add-ons. Canon's 1024-matrix reconstruction upgrade delivered 0.4 mm airway visualization on existing 320-row Aquilion installations, blurring performance gaps with high-slice peers. Consequently, manufacturers package AI-based metal-artifact reduction and calcium-scoring automation as subscription layers, reinforcing multi-year annuity models across the Japan computed tomography market.
Stationary scanners accounted for 91.05% of units in 2025, underscoring entrenched hospital work-flows and lead-lining requirements. Their throughput advantage bolsters ROI in facilities exceeding 40 patients per day, explaining continued procurement despite space constraints. Portable scanners, though a modest 8.95% slice, are advancing at a 6.72% CAGR on the back of disaster-resilience legislation that subsidizes two mobile units per prefecture. Field hospitals also deploy compact 32-row variants for neuro triage, dovetailing with population-aging policies that emphasize home-and-community care.
Technological cross-pollination lifts both segments. Photon-counting detector miniaturization allows vendors to ship battery-powered units without compromising spectral resolution, broadening clinical eligibility beyond head CT into thoracic and vascular indications. The shift accelerates revenue diversification across the Japan computed tomography market.
Complete Report Scope:
- By Technology (Slice Count)
- Low-slice (<64)
- Mid-slice (64)
- High-slice (128-256)
- By Product Type
- Stationary CT Scanners
- Portable / Mobile CT Scanners
- By Application
- Oncology
- Lung Cancer Screening
- Head & Neck Oncology
- Colorectal Oncology
- Other Oncology
- Cardiology
- Coronary CT Angiography
- Calcium Scoring
- Structural Heart Disease
- Neurology
- Stroke Assessment
- Brain Trauma
- Vascular
- Peripheral Vascular Disease
- Pulmonary Angiography
- Musculoskeletal
- Orthopedic Trauma
- Sports Injuries
- Dental & Maxillofacial
- Trauma & Emergency
- Other Applications
- Oncology
- By End-User
- Hospitals
- Public Hospitals
- Private Hospitals
- Diagnostic Imaging Centers
- Dental Clinics
- Veterinary Clinics & Hospitals
- Academic & Research Institutes
- Hospitals
List of Companies Covered in this Report:
- GE HealthCare Technologies Inc.
- Siemens Healthineers
- Canon
- Koninklijke Philips
- Shimadzu
- Fujifilm Healthcare Corp.
- Samsung Electronics Co., Ltd. (NeuroLogica)
- United Imaging Healthcare Co., Ltd.
- Mindray Bio-Medical Electronics Co., Ltd.
- Planmed
- NeuroLogica Corp. (subsidiary of Samsung)
- Mediso Medical Imaging Systems Ltd.
Additional Benefits:
- The market estimate (ME) sheet in Excel format
- 3 months of analyst support
TABLE OF CONTENTS
1 Introduction
- 1.1 Study Assumptions & Market Definition
- 1.2 Scope of the Study
2 Research Methodology
3 Executive Summary
4 Market Landscape
- 4.1 Market Overview
- 4.2 Market Drivers
- 4.2.1 Rapid adoption of photon-counting CT in academic centers
- 4.2.2 Ageing population-driven oncologic imaging demand
- 4.2.3 Disaster-preparedness funding for mobile CT fleets
- 4.2.4 Reimbursement incentives for AI-enabled low-dose protocols
- 4.2.5 Precision-oncology integration of CT radiomics
- 4.2.6 OEM-AI start-up retro-fit collaborations lowering upgrade cost
- 4.3 Market Restraints
- 4.3.1 High capital outlay amid declining scan fees
- 4.3.2 Shortage of radiologic technologists in rural prefectures
- 4.3.3 Stricter national diagnostic reference levels on dose
- 4.3.4 Slow PMDA approvals for next-gen detector technologies
- 4.4 Value / Supply-Chain Analysis
- 4.5 Regulatory Landscape
- 4.6 Technological Outlook
- 4.7 Porter's Five Forces
- 4.7.1 Threat of New Entrants
- 4.7.2 Bargaining Power of Suppliers
- 4.7.3 Bargaining Power of Buyers
- 4.7.4 Threat of Substitutes
- 4.7.5 Industry Rivalry
5 Market Size & Growth Forecasts (Value)
- 5.1 By Technology (Slice Count)
- 5.1.1 Low-slice (<64)
- 5.1.2 Mid-slice (64)
- 5.1.3 High-slice (128-256)
- 5.2 By Product Type
- 5.2.1 Stationary CT Scanners
- 5.2.2 Portable / Mobile CT Scanners
- 5.3 By Application
- 5.3.1 Oncology
- 5.3.1.1 Lung Cancer Screening
- 5.3.1.2 Head & Neck Oncology
- 5.3.1.3 Colorectal Oncology
- 5.3.1.4 Other Oncology
- 5.3.2 Cardiology
- 5.3.2.1 Coronary CT Angiography
- 5.3.2.2 Calcium Scoring
- 5.3.2.3 Structural Heart Disease
- 5.3.3 Neurology
- 5.3.3.1 Stroke Assessment
- 5.3.3.2 Brain Trauma
- 5.3.4 Vascular
- 5.3.4.1 Peripheral Vascular Disease
- 5.3.4.2 Pulmonary Angiography
- 5.3.5 Musculoskeletal
- 5.3.5.1 Orthopedic Trauma
- 5.3.5.2 Sports Injuries
- 5.3.6 Dental & Maxillofacial
- 5.3.7 Trauma & Emergency
- 5.3.8 Other Applications
- 5.3.1 Oncology
- 5.4 By End-User
- 5.4.1 Hospitals
- 5.4.1.1 Public Hospitals
- 5.4.1.2 Private Hospitals
- 5.4.2 Diagnostic Imaging Centers
- 5.4.3 Dental Clinics
- 5.4.4 Veterinary Clinics & Hospitals
- 5.4.5 Academic & Research Institutes
- 5.4.1 Hospitals
6 Competitive Landscape
- 6.1 Market Concentration
- 6.2 Market Share Analysis
- 6.3 Company Profiles {(includes Global level Overview, Market level overview, Core Segments, Financials as available, Strategic Information, Market Rank/Share for key companies, Products & Services, and Recent Developments)}
- 6.3.1 GE HealthCare Technologies Inc.
- 6.3.2 Siemens Healthineers AG
- 6.3.3 Canon Medical Systems Corp.
- 6.3.4 Koninklijke Philips N.V.
- 6.3.5 Shimadzu Corporation
- 6.3.6 Fujifilm Healthcare Corp.
- 6.3.7 Samsung Electronics Co., Ltd. (NeuroLogica)
- 6.3.8 United Imaging Healthcare Co., Ltd.
- 6.3.9 Mindray Bio-Medical Electronics Co., Ltd.
- 6.3.10 Planmed Oy
- 6.3.11 NeuroLogica Corp. (subsidiary of Samsung)
- 6.3.12 Mediso Medical Imaging Systems Ltd.
7 Market Opportunities & Future Outlook
- 7.1 White-space & Unmet-need Assessment

