PUBLISHER: Mordor Intelligence | PRODUCT CODE: 2119596

PUBLISHER: Mordor Intelligence | PRODUCT CODE: 2119596
Northern Virginia Data Center - Market Share Analysis, Industry Trends & Statistics, Growth Forecasts (2026 - 2031)
According to Mordor Intelligence, northern virginia data center market size in 2026 is estimated at 20.32 GW, growing from the 2025 value of 16.05 GW, with 2031 projections showing 43.52 GW, growing at a 3.38% CAGR over 2026-2031.
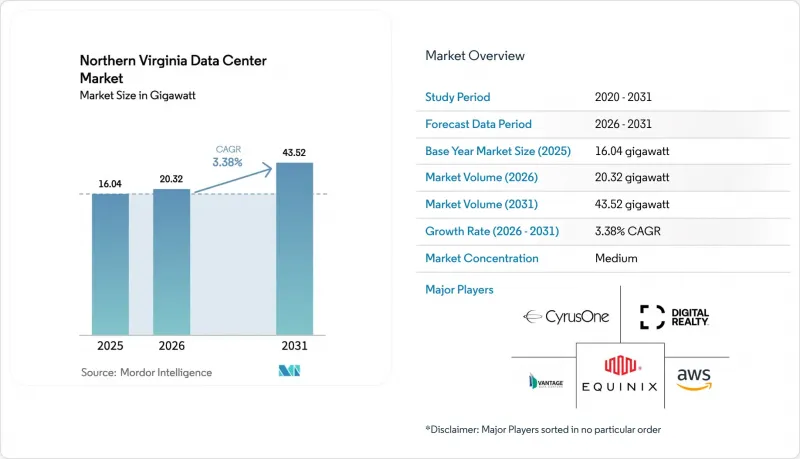
This report is Segmented by Data Center Size (Small, Medium, Large, Massive, Mega), Tier Type (Tier 1&2, Tier 3, Tier 4), Data Center Type(Colocation, Cloud Service Providers (CSPs), Enterprise, Modular, and Edge). The Market Forecasts are Provided in Terms of Value (USD).
Northern Virginia Data Center Market Trends and Insights
Rapid Hyperscale Cloud Expansion
Amazon Web Services operated more than 50 facilities in Northern Virginia by 2024, and Microsoft has underway projects totaling nearly 4 million ft2 in Manassas, underscoring the scale at which hyperscalers prefer to concentrate capacity. Concentration supports low-latency interconnection and economies of scale but magnifies regional reliance on Dominion Energy's grid. Traditional colocation providers are redesigning campuses; Digital Realty's Ashburn platform alone now supports 632 MW of IT load capacity. Heightened inter-campus cabling and dedicated substations have become routine project features, and power reservations for 100 MW blocks are no longer exceptional. However, Dominion's 2024 moratorium on new connections spotlighted how transmission congestion can slow even the deepest corporate wallets.
Record-High Fiber Density and Interconnection
The MAE-East legacy places Ashburn at the center of 337 active peering points across 16 Equinix sites, creating latency metrics few global metros can match.This dense network forces any cloud or AI provider needing sub-millisecond round-trip times to locate inside the same fiber catchment, reinforcing land price escalation. Proposals such as Active Infrastructure's 362-acre Leesburg campus couple behind-the-meter renewables with local fiber loops, illustrating a combined approach to grid risk and connectivity value. The combination of dark fiber loops, meet-me rooms, and subsea cable backhaul continues to elevate the region's indispensability for global backbone traffic.
Dominion Energy Grid Constraints
Dominion's 2024 Integrated Resource Plan projects an 85% rise in load over 15 years, necessitating 3.4 GW offshore wind, 12 GW solar, and 4.5 GW storage just to maintain supply adequacy. Temporary connection pauses through January 2026 created a bifurcated market where power-entitled projects trade at premiums, while greenfield sites wait in the queue. PJM Interconnection fielded 92 bids for transmission upgrades that could reach USD 51 billion, highlighting the scale of remediation. Developers increasingly request on-site gas turbines, battery storage, or renewable PPAs bundled with dedicated feeders to mitigate connection uncertainty. Yet such work-arounds add construction complexity and may face additional permitting scrutiny.
Other drivers and restraints analyzed in the detailed report include:
- Tax Incentives and Sales-and-Use-Tax Exemptions
- Surge in AI/ML and GPU Clusters
- Land-Use and Zoning Moratoria in Loudoun/Prince William
For complete list of drivers and restraints, kindly check the Table Of Contents.
Segment Analysis
Hyperscale facilities held 53.20% of the Northern Virginia data center market share in 2025 and will expand at a 3.85% CAGR through 2031. The Grove at Gainesville stretches a quarter-mile and needs power for 150,000 homes, illustrating the economies operators achieve when scaling HVAC plants, generators, and security operations. Large and medium footprints still secure lease wins from enterprises that value geographic diversity, yet the capital gravity of multi-gigawatt campuses is drawing investment toward the top end of the scale curve.
Hyperscale design also shifts construction toward multi-story steel superstructures that optimize scarce land but elevate mechanical complexity. STACK Infrastructure's 1 GW Stafford Technology Campus underscores this trend, covering 500 acres while accommodating 19 buildings engineered for liquid cooling and 300 MW battery reserves. Given its forecast capacity, the campus alone accounts for 7% of the Northern Virginia data center market in 2030. Rising community scrutiny may temper the pace, but the economic logic of aggregating capacity near fiber crossroads ensures that mega facilities will remain the defining form factor.
Complete Report Scope:
- By Data Center Size
- Small
- Medium
- Large
- Hyperscale
- By Tier Type
- Tier 1 and 2
- Tier 3
- Tier 4
- By Data Center Type
- Cloud Service Providers (CSPs)
- Enterprise, Modular and Edge
- Colocation
- Non-Utilized
- Utilized
- Colocation Type
- Retail
- Wholesale
- End User
- Cloud and IT
- Telecom
- Media and Entertainment
- Government
- BFSI
- Manufacturing
- E-Commerce
- Other End User
- Colocation Type
List of Companies Covered in this Report:
- Amazon Web Services, Inc.
- Microsoft Corporation
- Digital Realty Trust Inc.
- QTS Realty Trust, LLC
- Meta
- CyrusOne LLC
- STACK INFRASTRUCTURE
- CloudHQ LLC
- Equinix Inc.
- Aligned Data Centers
- Google LLC
- Menlo Equities LLC
- Vantage Data Centers Management Company, LLC
- NTT DATA GROUP Corporation
- Iron Mountain Information Management, LLC
- CoreSite
- Cologix, Inc.
- Yondr Group
- Corscale, LLC
- Csquare (Phoenix Infrastructure LLC)
- PowerHouse Data Centers
- DataBank Holdings Ltd.
Additional Benefits:
- The market estimate (ME) sheet in Excel format
- 3 months of analyst support
TABLE OF CONTENTS
1 INTRODUCTION
- 1.1 Study Assumptions and Market Definition
- 1.2 Scope of the Study
2 RESEARCH METHODOLOGY
3 EXECUTIVE SUMMARY
4 MARKET LANDSCAPE
- 4.1 Market Overview
- 4.2 Market Drivers
- 4.2.1 Rapid hyperscale cloud expansion
- 4.2.2 Record-high fiber density and interconnection
- 4.2.3 Tax incentives and sales-and-use-tax exemptions
- 4.2.4 Surge in AI / ML and GPU clusters
- 4.2.5 Corporate demand for 24X7 uptime (edge and latency)
- 4.2.6 Shift to sustainable / renewable power PPAs
- 4.3 Market Restraints
- 4.3.1 Dominion Energy grid constraints
- 4.3.2 Land-use and zoning moratoria in Loudoun/Prince William
- 4.3.3 Escalating construction and power-equipment costs
- 4.3.4 Water-use restrictions for advanced cooling
- 4.4 Value / Supply-Chain Analysis
- 4.5 Regulatory Landscape
- 4.6 Technological Outlook
- 4.7 Porter's Five Forces Analysis
- 4.7.1 Threat of New Entrants
- 4.7.2 Threat of Substitutes
- 4.7.3 Bargaining Power of Suppliers
- 4.7.4 Bargaining Power of Buyers
- 4.7.5 Competitive Rivalry
- 4.8 Assessment of Macro Economic Trends on the Market
5 MARKET SIZE AND GROWTH FORECASTS (MW)
- 5.1 By Data Center Size
- 5.1.1 Small
- 5.1.2 Medium
- 5.1.3 Large
- 5.1.4 Hyperscale
- 5.2 By Tier Type
- 5.2.1 Tier 1 and 2
- 5.2.2 Tier 3
- 5.2.3 Tier 4
- 5.3 By Data Center Type
- 5.3.1 Cloud Service Providers (CSPs)
- 5.3.2 Enterprise, Modular and Edge
- 5.3.3 Colocation
- 5.3.3.1 Non-Utilized
- 5.3.3.2 Utilized
- 5.3.3.2.1 Colocation Type
- 5.3.3.2.1.1 Retail
- 5.3.3.2.1.2 Wholesale
- 5.3.3.2.2 End User
- 5.3.3.2.2.1 Cloud and IT
- 5.3.3.2.2.2 Telecom
- 5.3.3.2.2.3 Media and Entertainment
- 5.3.3.2.2.4 Government
- 5.3.3.2.2.5 BFSI
- 5.3.3.2.2.6 Manufacturing
- 5.3.3.2.2.7 E-Commerce
- 5.3.3.2.2.8 Other End User
- 5.3.3.2.1 Colocation Type
6 COMPETITIVE LANDSCAPE
- 6.1 Market Concentration
- 6.2 Strategic Moves
- 6.3 Market Share Analysis
- 6.4 Company Profiles (includes Global level Overview, Market level overview, Core Segments, Financials as available, Strategic Information, Market Rank/Share for key companies, Products and Services, and Recent Developments)
- 6.4.1 Amazon Web Services, Inc.
- 6.4.2 Microsoft Corporation
- 6.4.3 Digital Realty Trust Inc.
- 6.4.4 QTS Realty Trust, LLC
- 6.4.5 Meta
- 6.4.6 CyrusOne LLC
- 6.4.7 STACK INFRASTRUCTURE
- 6.4.8 CloudHQ LLC
- 6.4.9 Equinix Inc.
- 6.4.10 Aligned Data Centers
- 6.4.11 Google LLC
- 6.4.12 Menlo Equities LLC
- 6.4.13 Vantage Data Centers Management Company, LLC
- 6.4.14 NTT DATA GROUP Corporation
- 6.4.15 Iron Mountain Information Management, LLC
- 6.4.16 CoreSite
- 6.4.17 Cologix, Inc.
- 6.4.18 Yondr Group
- 6.4.19 Corscale, LLC
- 6.4.20 Csquare (Phoenix Infrastructure LLC)
- 6.4.21 PowerHouse Data Centers
- 6.4.22 DataBank Holdings Ltd.
7 MARKET OPPORTUNITIES AND FUTURE OUTLOOK
- 7.1 White-space and Unmet-Need Assessment

