PUBLISHER: Mordor Intelligence | PRODUCT CODE: 2122221

PUBLISHER: Mordor Intelligence | PRODUCT CODE: 2122221
Aviation Fuel - Market Share Analysis, Industry Trends & Statistics, Growth Forecasts (2026 - 2031)
According to Mordor Intelligence, the aviation fuel market size is expected to increase from USD 306.48 billion in 2025 to USD 341.48 billion in 2026 and reach USD 548.71 billion by 2031, growing at a CAGR of 9.95% over 2026-2031.
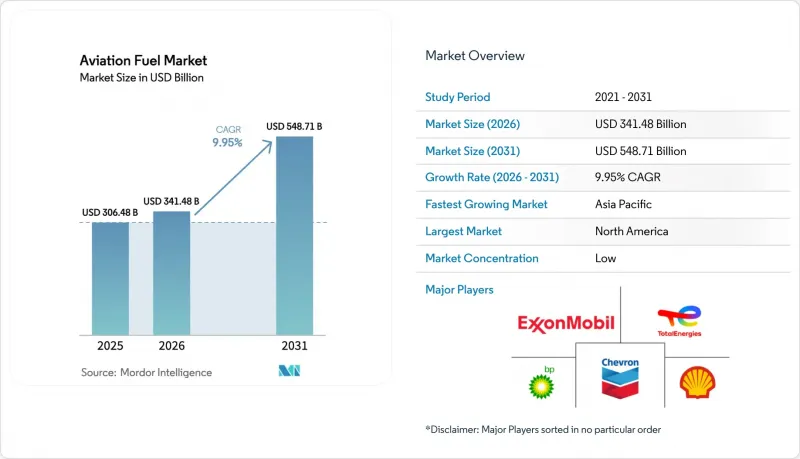
This report is Segmented by Fuel Type (Conventional Jet Fuel, Sustainable Aviation Fuel, and Avgas), Aircraft Type (Narrow-Body, Wide-Body, Regional Jets and Turboprops, and Cargo/Freighters), Application (Commercial Airlines, Defense/Military Aviation, and General and Business Aviation), and Geography (North America, Europe, Asia Pacific, South America, and Middle East and Africa).
Global Aviation Fuel Market Trends and Insights
Surging Post-Pandemic Passenger Traffic Recovery
Passenger enplanements rebounded to 4.7 billion in 2024, equal to the 2019 peak, and IATA projects 8.8 billion by 2040. Leisure travel returned first, corporate trips later, yet both segments now outstrip pre-crisis levels on many regional routes. Load-factor optimization is intensifying fuel uplift per cycle because fuller cabins translate every additional seat into extra kerosene uplift despite fleet efficiency gains. Asia-Pacific and the Middle East show double-digit demand growth as rising middle-class incomes intersect with liberalized air-service agreements. China alone added over 100 million domestic passengers in 2024, while India crossed the 200 million mark, underpinning continuous refueling demand at secondary airports. Point-to-point networks enabled by long-range narrow-bodies disperse fuel demand beyond mega-hubs, reshaping distributor logistics across the aviation fuel market.
Expansion of Low-Cost Carriers in Emerging Markets
Low-cost carriers (LCCs) rose to 35% of global seat capacity in 2024, up from 30% in 2019, capturing share across India, Southeast Asia, and Latin America. IndiGo operated 370 aircraft in 2025 and ordered another 500 A320neo-family jets, ensuring a decade-long fuel-consumption uptrend. AirAsia, Volaris, and JetSMART emulate the ultra-low-cost template, stimulating new traffic rather than displacing incumbents. LCC aircraft typically fly 12-14 hours daily, outpacing full-service carriers in utilization and thereby sustaining higher daily fuel demand. Open-skies pacts and incentives such as India's UDAN scheme reduce route-launch friction, letting LCCs penetrate secondary cities where fuel-farm infrastructure remains limited, compelling suppliers to extend into new geographies within the aviation fuel market.
Volatile Crude-Oil Pricing and Carbon-Pricing/CORSIA Compliance Costs
Brent prices oscillated between USD 70-90 per barrel through 2024-2025, with each USD 10 swing moving airline operating costs by 3-4%. Jet-fuel crack spreads widened as European capacity closed, magnifying price spikes from geopolitical shocks. CORSIA's pilot phase began in 2024, obligating carriers to buy carbon credits for growth above 2019 baselines at USD 1-3 per ton, set to rise toward USD 20 by 2027. EU ETS exposure further burdens European operators with allowances near EUR 80 per ton (USD 87) in early 2025. Combined fuel and carbon volatility amplifies margin risk, fueling consolidation and spurring airlines to lock in multiyear SAF deals that stabilize the compliance component of the aviation fuel market.
Other drivers and restraints analyzed in the detailed report include:
- Fleet Modernization and Delivery of Fuel-Efficient Aircraft
- Rising Defense Aviation Spending, Air-Cargo Freighter Conversions, and PtL E-Kerosene Capacity
- SAF Feedstock Supply Bottlenecks and Rapid Aircraft/Engine Energy-Efficiency Gains
For complete list of drivers and restraints, kindly check the Table Of Contents.
Segment Analysis
Conventional jet fuel underpinned 96.1% of volume and revenue in 2025, yet tightening mandates drive SAF to a 37.0% CAGR through 2031, the fastest among all sub-segments. Neste expanded Singapore capacity to 2.2 million tons per year, locking in long-term offtake with multiple European and Asian carriers. U.S. refiners such as ExxonMobil and Phillips 66 are co-processing waste oils to secure early compliance under Inflation Reduction Act credits. Within the aviation fuel market size, SAF's dollar share overtakes its volumetric share because premium pricing outweighs blended volumes, supporting margin expansion despite feedstock volatility.
The aviation fuel market size attached to Avgaz remains marginal and trends downward as piston-engine fleets age out and unleaded substitutes progress under the FAA's EAGLE program. Conventional jet fuel remains indispensable throughout the decade due to installed turbine fleets and global pipeline-to-wing infrastructure, yet its incremental growth moderates. PtL e-kerosene and alcohol-to-jet pathways diversify feedstocks beyond lipid-based HEFA, though commercialization hinges on electrolyzer-cost compression, CO2-capture infrastructure, and clear lifecycle-emission accounting. Suppliers that balance co-processing retrofits with greenfield PtL investments build optionality, positioning to capture the aviation fuel market share redistribution as mandates accelerate post-2030.
Complete Report Scope:
- By Fuel Type
- Conventional Jet Fuel
- Sustainable Aviation Fuel (SAF)
- Avgas
- By Aircraft Type
- Narrow-body
- Wide-body
- Regional Jets and Turboprops
- Cargo/Freighters
- By Application
- Commercial Airlines
- Defense/Military Aviation
- General and Business Aviation
- By Geography
- North America
- United States
- Canada
- Mexico
- Europe
- Germany
- United Kingdom
- France
- Spain
- Italy
- NORDIC Countries
- Russia
- Rest of Europe
- Asia-Pacific
- China
- India
- Japan
- South Korea
- ASEAN Countries
- Australia and New Zealand
- Rest of Asia-Pacific
- South America
- Brazil
- Argentina
- Chile
- Rest of South America
- Middle East and Africa
- Saudi Arabia
- United Arab Emirates
- South Africa
- Egypt
- Rest of Middle East and Africa
- North America
Geography Analysis
North America accounted for 37.7% of global demand in 2025, supported by hub-and-spoke structures, a large general-aviation fleet, and early SAF tax incentives. Integrated majors such as Chevron and Phillips 66 will add more than 500 million gallons of SAF capacity by 2027 through refinery retrofits, anchoring regional supply. Canadian northern-route optimization and Mexican LCC expansion together add incremental uplift, while NextGen air-traffic management trims per-flight fuel burn yet fails to offset aggregate volume tied to rising flight numbers. The aviation fuel market benefits from stable policy, accessible feedstocks, and mature logistics, sustaining moderate growth despite fleet efficiency gains.
Asia-Pacific is expected to register a 12.6% CAGR, the fastest regional expansion, as China's airport-construction spree and India's domestic boom widen the fuel-demand base. ASEAN liberalization lets carriers open secondary city pairs, decentralizing supply chains and multiplying refueling points. Japan and South Korea focus on SAF R&D and hydrogen demonstrations, hoping to export technology while tackling domestic carbon caps. Australia's ultra-long-haul plans, such as Qantas Project Sunrise, reinforce demand for high-energy-density fuels, including SAF blends. This diversity of growth engines cements Asia-Pacific as the pivotal contributor to the incremental aviation fuel market size during the outlook period.
Europe operates under the strictest decarbonization regime; ReFuelEU Aviation sets a 2% SAF mandate in 2025, rising steeply thereafter, compelling refiners and airports to build blending and storage infrastructure. Carbon prices above USD 80 per ton accelerate legacy fleet retirements and drive airlines toward long-term SAF contracts with Neste and LanzaJet. The Middle East continues hub-centric expansion; Emirates, Qatar Airways, and Etihad each grow wide-body capacity, while ADNOC invests in SAF capacity to reinforce the UAE's hub status. South America recovers alongside Brazil's domestic market, yet wrestles with infrastructure gaps and currency volatility. Africa remains under-penetrated; Ethiopian Airlines leads intra-continental expansion, prompting localized fuel-farm investments. Collectively, these dynamics shape a multipolar aviation fuel market in which policy, capital intensity, and traffic trends vary sharply by region.
- Exxon Mobil Corporation
- Shell plc
- BP plc (Air BP)
- Chevron Corporation
- TotalEnergies SE (Air Total)
- Gazprom Neft PJSC
- Phillips 66
- Valero Energy Corporation
- Abu Dhabi National Oil Company (ADNOC)
- Emirates National Oil Company
- Indian Oil Corporation Ltd
- Bharat Petroleum Corp Ltd
- World Fuel Services Corp
- Vitol Aviation
- Neste Oyj
- LanzaJet Inc.
- Gevo Inc.
- Honeywell UOP
- Red Rock Biofuels LLC
- Swedish Biofuels AB
- Allied Aviation Services Inc.
Additional Benefits:
- The market estimate (ME) sheet in Excel format
- 3 months of analyst support
TABLE OF CONTENTS
1 Introduction
- 1.1 Study Assumptions & Market Definition
- 1.2 Scope of the Study
2 Research Methodology
3 Executive Summary
4 Market Landscape
- 4.1 Market Overview
- 4.2 Market Drivers
- 4.2.1 Surging post-pandemic passenger traffic recovery
- 4.2.2 Expansion of low-cost carriers in emerging markets
- 4.2.3 Fleet modernization & delivery of new fuel-efficient aircraft
- 4.2.4 Rising defense aviation spending worldwide
- 4.2.5 Booming air-cargo freighter conversions
- 4.2.6 Build-out of power-to-liquid (PtL) e-kerosene capacity
- 4.3 Market Restraints
- 4.3.1 Volatile crude-oil price environment
- 4.3.2 Carbon-pricing & CORSIA compliance costs
- 4.3.3 SAF feedstock supply bottlenecks
- 4.3.4 Rapid gains in aircraft /engine energy efficiency
- 4.4 Supply-Chain Analysis
- 4.5 Regulatory Landscape
- 4.6 Technological Outlook
- 4.7 Porter's Five Forces
- 4.7.1 Bargaining Power of Suppliers
- 4.7.2 Bargaining Power of Buyers
- 4.7.3 Threat of New Entrants
- 4.7.4 Threat of Substitutes
- 4.7.5 Intensity of Competitive Rivalry
5 Market Size & Growth Forecasts
- 5.1 By Fuel Type
- 5.1.1 Conventional Jet Fuel
- 5.1.2 Sustainable Aviation Fuel (SAF)
- 5.1.3 Avgas
- 5.2 By Aircraft Type
- 5.2.1 Narrow-body
- 5.2.2 Wide-body
- 5.2.3 Regional Jets and Turboprops
- 5.2.4 Cargo/Freighters
- 5.3 By Application
- 5.3.1 Commercial Airlines
- 5.3.2 Defense/Military Aviation
- 5.3.3 General and Business Aviation
- 5.4 By Geography
- 5.4.1 North America
- 5.4.1.1 United States
- 5.4.1.2 Canada
- 5.4.1.3 Mexico
- 5.4.2 Europe
- 5.4.2.1 Germany
- 5.4.2.2 United Kingdom
- 5.4.2.3 France
- 5.4.2.4 Spain
- 5.4.2.5 Italy
- 5.4.2.6 NORDIC Countries
- 5.4.2.7 Russia
- 5.4.2.8 Rest of Europe
- 5.4.3 Asia-Pacific
- 5.4.3.1 China
- 5.4.3.2 India
- 5.4.3.3 Japan
- 5.4.3.4 South Korea
- 5.4.3.5 ASEAN Countries
- 5.4.3.6 Australia and New Zealand
- 5.4.3.7 Rest of Asia-Pacific
- 5.4.4 South America
- 5.4.4.1 Brazil
- 5.4.4.2 Argentina
- 5.4.4.3 Chile
- 5.4.4.4 Rest of South America
- 5.4.5 Middle East and Africa
- 5.4.5.1 Saudi Arabia
- 5.4.5.2 United Arab Emirates
- 5.4.5.3 South Africa
- 5.4.5.4 Egypt
- 5.4.5.5 Rest of Middle East and Africa
- 5.4.1 North America
6 Competitive Landscape
- 6.1 Market Concentration
- 6.2 Strategic Moves (M&A, Partnerships, PPAs)
- 6.3 Market Share Analysis (Market Rank/Share for key companies)
- 6.4 Company Profiles (includes Global level Overview, Market level overview, Core Segments, Financials as available, Strategic Information, Products & Services, and Recent Developments)
- 6.4.1 Exxon Mobil Corporation
- 6.4.2 Shell plc
- 6.4.3 BP plc (Air BP)
- 6.4.4 Chevron Corporation
- 6.4.5 TotalEnergies SE (Air Total)
- 6.4.6 Gazprom Neft PJSC
- 6.4.7 Phillips 66
- 6.4.8 Valero Energy Corporation
- 6.4.9 Abu Dhabi National Oil Company (ADNOC)
- 6.4.10 Emirates National Oil Company
- 6.4.11 Indian Oil Corporation Ltd
- 6.4.12 Bharat Petroleum Corp Ltd
- 6.4.13 World Fuel Services Corp
- 6.4.14 Vitol Aviation
- 6.4.15 Neste Oyj
- 6.4.16 LanzaJet Inc.
- 6.4.17 Gevo Inc.
- 6.4.18 Honeywell UOP
- 6.4.19 Red Rock Biofuels LLC
- 6.4.20 Swedish Biofuels AB
- 6.4.21 Allied Aviation Services Inc.
7 Market Opportunities & Future Outlook
- 7.1 White-space & unmet-need assessment

