PUBLISHER: Mordor Intelligence | PRODUCT CODE: 2122276

PUBLISHER: Mordor Intelligence | PRODUCT CODE: 2122276
Singapore Freight And Logistics - Market Share Analysis, Industry Trends & Statistics, Growth Forecasts (2026 - 2031)
According to Mordor Intelligence, the Singapore freight and logistics market size is projected to be USD 24.53 billion in 2025, USD 26.11 billion in 2026, and reach USD 35.37 billion by 2031, growing at a CAGR of 6.26% from 2026 to 2031.
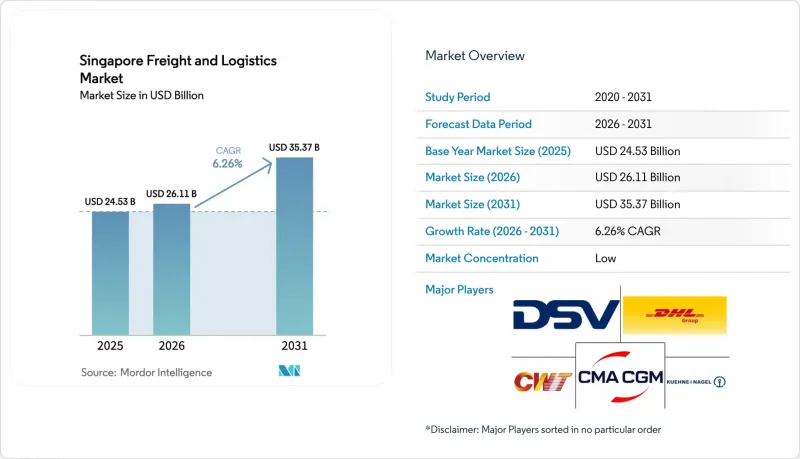
This report is Segmented by End User Industry (Agriculture, Fishing, and Forestry, Construction, Manufacturing, Wholesale and Retail Trade, Oil and Gas, Mining, and Quarrying, and Others), and by Logistics Function (Courier, Express, and Parcel (CEP), Freight Forwarding, Freight Transport, Warehousing and Storage, and Other Services). The Market Forecasts are Provided in Terms of Value (USD).
Singapore Freight And Logistics Market Trends and Insights
Government investment in port and logistics infrastructure
Singapore is channeling significant capital into backbone assets. The Tuas Port complex, built for 65 million TEU ultimate capacity, began Phase 1 operations in September 2024 and is already handling automated yard moves that reduce berth time by 20%. A SGD 647.5 million (USD 476.65 million) Supply Chain Hub scheduled for 2027 completion will integrate autonomous cranes with the SGTraDex data layer, enabling real-time inventory repositioning for manufacturers. Complementing port upgrades, the Land Transport Authority is piloting a Green Freight Corridor that offers SGD 40,000 incentives per heavy battery-electric truck from 2026, supported by battery-swap stations along key industrial routes. These initiatives reinforce Singapore freight and logistics market competitiveness by unlocking capacity, trimming dwell time, and sharpening the city-state's cost advantage over regional rivals.
Explosive B2C e-commerce parcel volumes
Online shopping penetration reached 88%, pushing the domestic e-commerce value to SGD 7.9 billion (USD 5.81 billion) in 2023 and a projected SGD 11.3 billion (USD 8.31 billion) by 2028. Parcel volumes rose in double digits, with SingPost handling more than 200 million items in 2024. Capacity pressure triggered investment in automated sortation hubs and last-mile micro-fulfillment sites by DHL and SF Express, which together deployed electric cargo bikes to shave urban delivery costs by 15%. Cross-border flows add momentum as ASEAN e-commerce is forecast to touch USD 211 billion by 2025, routing high-yield parcels through Changi Airport's express facilities.
Acute labor shortage and escalating manpower costs
Transport job vacancies rose to 3,800 in Q3 2024 from 2,800 a year earlier, and median sector wages climbed 5.4% in 2023. Foreign-worker quota ceilings hold at 38% of headcount, pushing logistics operators toward automation. SATS deployed autonomous mobile robots that trimmed manual cargo handling by 30%. Smaller firms face cash-flow pressure because robotics outlays entail multi-year payback horizons. The Progressive Wage Model will add further cost escalation through 2026, possibly driving basic warehousing activities to lower-cost sites over the border.
Other drivers and restraints analyzed in the detailed report include:
- Singapore's role as trans-shipment hub for ASEAN + Indo-Pacific
- Accelerated digitalization and 3PL outsourcing by SMEs
- Land scarcity limiting new warehousing capacity
For complete list of drivers and restraints, kindly check the Table Of Contents.
Segment Analysis
Wholesale and Retail Trade generated 30.96% of 2025 revenue, driven by omnichannel grocery and electronics distribution. Manufacturing, however, delivers the fastest 6.76% CAGR (2026-2031), buoyed by USD 177.8 billion in 2024 factory output spread across semiconductors and biomedical products. Precision sectors require strict climate control and short turnaround, lifting demand for specialized freight.
Oil, Gas, Mining, and Quarrying provides steady petrochemical flows from Jurong Island. Construction activity tied to Tuas Port and rapid transit infrastructure sustains heavy-haul demand, though growth moderates once flagship projects near completion. Agriculture remains minor but gains attention under the "30 by 30" local food plan, adding niche cold-chain requirements.
Freight Transport held 61.26% of Singapore freight and logistics market share in 2025, anchored by maritime and air-cargo flows that benefit from the city-state's trans-shipment strength. The segment will continue expanding, though its share inches lower as CEP accelerates. CEP revenue is set to climb at a 7.20% CAGR (2026-2031) on the back of domestic online retail and ASEAN cross-border orders. Warehousing follows in the mid-teens share, posting a 6.50% CAGR (2026-2031) as real-time visibility tools foster just-in-time stocking. Freight Forwarding gains incremental value from SME digitization, with TradeNet documentation cuts translating into faster customs release. Operators bundle insurance, brokerage, and packaging services to support compliance in data-localization regimes.
Parcel giants are blurring the line between CEP and forwarding. DHL and Kuehne+Nagel already cross-utilize linehaul capacity, boosting load factors and lowering unit cost. This convergence will reshape how the Singapore freight and logistics market allocates capital because express carriers now compete head-to-head with traditional forwarders for mid-weight cargo. Yet regulatory light-touch remains; IMDA's data rules drive specialized compliance work but do not create significant entry barriers for tech-enabled challengers.
Complete Report Scope:
- By End-User Industry
- Agriculture, Fishing, and Forestry
- Construction
- Manufacturing
- Oil and Gas, Mining, and Quarrying
- Wholesale and Retail Trade
- Others
- By Logistics Function
- Courier, Express and Parcel (CEP)
- By Destination Type
- Domestic
- International
- By Destination Type
- Freight Forwarding
- By Mode of Transport
- Air
- Sea and Inland Waterways
- Others
- By Mode of Transport
- Freight Transport
- By Mode of Transport
- Air
- Pipelines
- Rail
- Road
- Sea and Inland Waterways
- By Mode of Transport
- Warehousing and Storage
- By Temperature Control
- Non-Temperature-Controlled
- Temperature-Controlled
- By Temperature Control
- Other Services
- Courier, Express and Parcel (CEP)
List of Companies Covered in this Report:
- A.P. Moller - Maersk
- CJ Logistics Corporation
- CMA CGM Group (Including CEVA Logistics, and Bollore Logistics)
- CWT Pte, Ltd.
- DHL Group
- DSV A/S (Including DB Schenker)
- FedEx
- GEODIS (Including Keppel Logistics Pte Ltd.)
- Kuehne+Nagel
- Nippon Express Holdings, Inc.
- Pacific International Lines Pte, Ltd.
- Poh Tiong Choon Logistics, Ltd.
- PSA International
- SATS, Ltd.
- SF Express (KEX-SF)
- Singapore Post, Ltd.
- ST Logistics Pte, Ltd.
- United Parcel Service of America, Inc. (UPS)
- Vibrant Group, Ltd.
- Yamato Holdings Co., Ltd.
- YCH Group
Additional Benefits:
- The market estimate (ME) sheet in Excel format
- 3 months of analyst support
TABLE OF CONTENTS
1 Introduction
- 1.1 Study Assumptions and Market Definition
- 1.2 Scope of the Study
2 Research Methodology
3 Executive Summary
4 Market Landscape
- 4.1 Market Overview
- 4.2 Demographics
- 4.3 GDP Distribution by Economic Activity
- 4.4 GDP Growth by Economic Activity
- 4.5 Inflation
- 4.6 Economic Performance and Profile
- 4.6.1 Trends in E-Commerce Industry
- 4.6.2 Trends in Manufacturing Industry
- 4.7 Transport and Storage Sector GDP
- 4.8 Export Trends
- 4.9 Import Trends
- 4.10 Fuel Price
- 4.11 Trucking Operational Costs
- 4.12 Trucking Fleet Size by Type
- 4.13 Logistics Performance
- 4.14 Modal Share
- 4.15 Maritime Fleet Load Carrying Capacity
- 4.16 Liner Shipping Connectivity
- 4.17 Port Calls and Performance
- 4.18 Freight Pricing Trends
- 4.19 Freight Tonnage Trends
- 4.20 Infrastructure
- 4.21 Regulatory Framework (Road and Rail)
- 4.22 Regulatory Framework (Sea and Air)
- 4.23 Value Chain and Distribution Channel Analysis
- 4.24 Market Drivers
- 4.24.1 Government Investment in Port and Logistics Infrastructure
- 4.24.2 Explosive B2C E-commerce Parcel Volumes
- 4.24.3 Singapore's Role as Trans-Shipment Hub for ASEAN + Indo-Pacific
- 4.24.4 Accelerated Digitalisation and 3PL Outsourcing by SMEs
- 4.24.5 SGTraDex Data-Exchange Adoption Boosting Supply-Chain Visibility
- 4.24.6 Green Freight Corridor Pilot for Battery-Electric Trucks
- 4.25 Market Restraints
- 4.25.1 Acute Labor Shortage and Escalating Manpower Costs
- 4.25.2 Land Scarcity Limiting New Warehousing Capacity
- 4.25.3 High Exposure to Global Trade Cycle Volatility
- 4.25.4 Tightening Carbon-Emission Rules Increasing Compliance Cost
- 4.26 Technological Outlook
- 4.27 Porter's Five Forces Analysis
- 4.27.1 Threat of New Entrants
- 4.27.2 Bargaining Power of Buyers
- 4.27.3 Bargaining Power of Suppliers
- 4.27.4 Threat of Substitutes
- 4.27.5 Competitive Rivalry
5 Market Size and Growth Forecasts (Value in USD)
- 5.1 By End-User Industry
- 5.1.1 Agriculture, Fishing, and Forestry
- 5.1.2 Construction
- 5.1.3 Manufacturing
- 5.1.4 Oil and Gas, Mining, and Quarrying
- 5.1.5 Wholesale and Retail Trade
- 5.1.6 Others
- 5.2 By Logistics Function
- 5.2.1 Courier, Express and Parcel (CEP)
- 5.2.1.1 By Destination Type
- 5.2.1.1.1 Domestic
- 5.2.1.1.2 International
- 5.2.1.1 By Destination Type
- 5.2.2 Freight Forwarding
- 5.2.2.1 By Mode of Transport
- 5.2.2.1.1 Air
- 5.2.2.1.2 Sea and Inland Waterways
- 5.2.2.1.3 Others
- 5.2.2.1 By Mode of Transport
- 5.2.3 Freight Transport
- 5.2.3.1 By Mode of Transport
- 5.2.3.1.1 Air
- 5.2.3.1.2 Pipelines
- 5.2.3.1.3 Rail
- 5.2.3.1.4 Road
- 5.2.3.1.5 Sea and Inland Waterways
- 5.2.3.1 By Mode of Transport
- 5.2.4 Warehousing and Storage
- 5.2.4.1 By Temperature Control
- 5.2.4.1.1 Non-Temperature-Controlled
- 5.2.4.1.2 Temperature-Controlled
- 5.2.4.1 By Temperature Control
- 5.2.5 Other Services
- 5.2.1 Courier, Express and Parcel (CEP)
6 Competitive Landscape
- 6.1 Market Concentration
- 6.2 Strategic Moves
- 6.3 Market Share Analysis
- 6.4 Company Profiles (includes Global Level Overview, Market Level Overview, Core Segments, Financials as Available, Strategic Information, Market Rank/Share for Key Companies, Products and Services, and Recent Developments)
- 6.4.1 A.P. Moller - Maersk
- 6.4.2 CJ Logistics Corporation
- 6.4.3 CMA CGM Group (Including CEVA Logistics, and Bollore Logistics)
- 6.4.4 CWT Pte, Ltd.
- 6.4.5 DHL Group
- 6.4.6 DSV A/S (Including DB Schenker)
- 6.4.7 FedEx
- 6.4.8 GEODIS (Including Keppel Logistics Pte Ltd.)
- 6.4.9 Kuehne+Nagel
- 6.4.10 Nippon Express Holdings, Inc.
- 6.4.11 Pacific International Lines Pte, Ltd.
- 6.4.12 Poh Tiong Choon Logistics, Ltd.
- 6.4.13 PSA International
- 6.4.14 SATS, Ltd.
- 6.4.15 SF Express (KEX-SF)
- 6.4.16 Singapore Post, Ltd.
- 6.4.17 ST Logistics Pte, Ltd.
- 6.4.18 United Parcel Service of America, Inc. (UPS)
- 6.4.19 Vibrant Group, Ltd.
- 6.4.20 Yamato Holdings Co., Ltd.
- 6.4.21 YCH Group
7 Market Opportunities and Future Outlook
- 7.1 White-Space and Unmet-Need Assessment

