PUBLISHER: Mordor Intelligence | PRODUCT CODE: 2123764

PUBLISHER: Mordor Intelligence | PRODUCT CODE: 2123764
Oil And Gas Downstream - Market Share Analysis, Industry Trends & Statistics, Growth Forecasts (2026 - 2031)
According to Mordor Intelligence, oil and gas downstream market size market size in 2026 is estimated at USD 104.03 billion, growing from 2025 value of USD 100.16 billion with 2031 projections showing USD 125.74 billion, growing at 3.86% CAGR over 2026-2031.
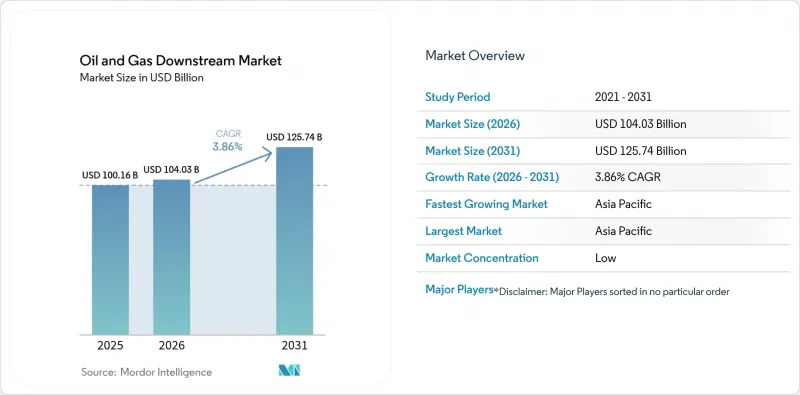
This report is Segmented by Type (Refineries and Petrochemical Plants), Product Type (Refined Petroleum Products, Petrochemicals, and Lubricants), Distribution Channel (Direct Sales/Wholesale, Distributors/Commercial, and Retail), and Geography (North America, Europe, Asia-Pacific, South America, and Middle East and Africa). The Market Sizes and Forecasts are Provided in Terms of Value (USD).
Global Oil And Gas Downstream Market Trends and Insights
Surge in Refining Capacity Expansion Drives Regional Rebalancing
Asia-Pacific and Middle Eastern projects, totaling 4.9 million b/d between 2024 and 2028, are tilting global economics toward these hubs, giving integrated operators scale and feedstock proximity advantages while compressing European and North American margins.
Petrochemical Demand Growth Transforms Refinery Economics
Petrochemicals already account for 14% of global oil demand and are expected to rise further, prompting refiners to reconfigure their operations toward naphtha cracking and aromatics extraction in integrated complexes, as exemplified by Saudi Aramco's Motiva and China's coastal mega-projects.
Electric Vehicle Adoption Pressures Gasoline Demand Fundamentals
Global EV sales reached 14 million units in 2024, accelerating the decline in gasoline demand in Europe and certain segments of China, prompting refiners to shift their focus toward diesel, jet fuel, and petrochemicals.
Other drivers and restraints analyzed in the detailed report include:
- IMO Sulfur Regulations Drive Ongoing Compliance Investments
- Aviation-Fuel Recovery and SAF Mandates Create New Revenue Streams
- Net-Zero Climate Policies Constrain Long-Term Investment Horizons
For complete list of drivers and restraints, kindly check the Table Of Contents.
Segment Analysis
Refineries accounted for 65.25% of the Oil & Gas Downstream market in 2025 and should advance at a 4.52% CAGR, a pace underpinned by asset-utilization upgrades and petrochemical add-ons. This segment benefits from a flexible configuration that toggles between transport fuels and chemical feedstocks based on real-time margin signals. Saudi Aramco's Motiva expansion and Reliance's Jamnagar complex exemplify the scale synergies that lower per-barrel costs and enhance hydrocracker yields. Integrated builds blur the lines with petrochemical plants, raising barriers for smaller standalone facilities.
Petrochemical plants, although holding a smaller 34.75% share, post a 4.72% trajectory as naphtha crackers and propane dehydrogenation units proliferate in the Asia-Pacific region. Operators bundle shared utilities, logistics, and hydrogen networks to exploit co-product valorization. Yet feedstock-price swings and competition from integrated mega-sites temper standalone economics. Overall, the Oil & Gas Downstream market size gains resilience from this dual-track capacity strategy.
Complete Report Scope:
- By Type
- Refineries
- Petrochemical Plants
- By Product Type
- Refined Petroleum Products
- Petrochemicals
- Lubricants
- By Distribution Channel
- Direct Sales/Wholesale
- Distributors/Commercial
- Retail
- By Geography
- North America
- United States
- Canada
- Mexico
- Europe
- Germany
- United Kingdom
- Norway
- Netherlands
- Russia
- Rest of Europe
- Asia-Pacific
- China
- India
- Japan
- South Korea
- ASEAN Countries
- Australia
- Rest of Asia Pacific
- South America
- Brazil
- Argentina
- Colombia
- Rest of South America
- Middle East and Africa
- Saudi Arabia
- United Arab Emirates
- Qatar
- South Africa
- Nigeria
- Rest of Middle East and Africa
- North America
Geography Analysis
The Asia-Pacific region leads with a 32.85% share in 2025 and is expected to grow at a rate of 4.92% annually due to capacity surges in China, India, and Southeast Asia, where demographic tailwinds, industrialization, and policy support converge. China's petrochemical pull counters peaking gasoline use, while Indian refiners chase export premiums to Africa and Latin America. Indonesia, Malaysia, and Thailand strengthen their product balance through hub-and-spoke logistics along vital sea lanes.
North America, despite a decline in gasoline demand, exploits ethane-rich shale to feed petrochemical crackers and hydrotreaters, thereby anchoring competitive cash costs. U.S. consolidators such as Phillips 66 retrofit units for renewable diesel to align with California's LCFS and federal SAF incentives. Canada's heavy-oil upgraders and Mexico's government-driven builds diversify feedstock slates, though financing hurdles persist for new standalone capacity.
Europe navigates declining fuel volumes under the Fit-for-55 umbrella by converting sites into bio-hubs producing HVO and SAF, while integrating CCS clusters to mitigate residual CO2. Middle Eastern projects, such as ADNOC's Ruwais Phase II, leverage gas-liquids streams and subsidized utilities to serve EU and Asian importers. Africa is witnessing emerging complexes in Nigeria and Angola, but it is contending with capital scarcity. Meanwhile, Brazil's Petrobras balances domestic demand coverage with volatility in currency and policy cycles, collectively steering the regional mosaic of the oil and gas downstream market.
- China Petroleum & Chemical Corp (Sinopec)
- Exxon Mobil Corporation
- Royal Dutch Shell plc
- Saudi Arabian Oil Company (Saudi Aramco)
- BP plc
- TotalEnergies SE
- China National Petroleum Corporation (CNPC)
- Reliance Industries Limited
- Indian Oil Corporation Limited
- Chevron Corporation
- Phillips 66 Company
- Marathon Petroleum Corporation
- Valero Energy Corporation
- Petroleo Brasileiro S.A. (Petrobras)
- ENI S.p.A.
- PTT Public Company Limited
- SK Innovation Co., Ltd.
- Kuwait Petroleum Corporation
- Lukoil PJSC
- OMV Group
Additional Benefits:
- The market estimate (ME) sheet in Excel format
- 3 months of analyst support
TABLE OF CONTENTS
1 Introduction
- 1.1 Study Assumptions & Market Definition
- 1.2 Scope of the Study
2 Research Methodology
3 Executive Summary
4 Market Landscape
- 4.1 Market Overview
- 4.2 Market Drivers
- 4.2.1 Surge in refining capacity (APAC & Middle East)
- 4.2.2 Booming petrochemical demand
- 4.2.3 Stricter IMO 2020 & sulfur fuel rules
- 4.2.4 Aviation-fuel rebound & SAF mandates
- 4.2.5 Digital-twin/AI OPEX optimization
- 4.2.6 Hydrogen co-product monetization
- 4.3 Market Restraints
- 4.3.1 EV penetration eroding gasoline demand
- 4.3.2 Net-zero policies curbing fossil fuels
- 4.3.3 Climate-risk-driven downtime & insurance
- 4.3.4 High interest rates limit new refineries
- 4.4 Supply-Chain Analysis
- 4.5 Regulatory Landscape
- 4.6 Technological Outlook
- 4.7 Refinery Throughput Capacity Analysis
- 4.8 Key Projects Information
- 4.9 Porter's Five Forces
- 4.9.1 Bargaining Power of Suppliers
- 4.9.2 Bargaining Power of Buyers
- 4.9.3 Threat of New Entrants
- 4.9.4 Threat of Substitutes
- 4.9.5 Intensity of Competitive Rivalry
- 4.10 PESTLE Analysis
5 Market Size & Growth Forecasts
- 5.1 By Type
- 5.1.1 Refineries
- 5.1.2 Petrochemical Plants
- 5.2 By Product Type
- 5.2.1 Refined Petroleum Products
- 5.2.2 Petrochemicals
- 5.2.3 Lubricants
- 5.3 By Distribution Channel
- 5.3.1 Direct Sales/Wholesale
- 5.3.2 Distributors/Commercial
- 5.3.3 Retail
- 5.4 By Geography
- 5.4.1 North America
- 5.4.1.1 United States
- 5.4.1.2 Canada
- 5.4.1.3 Mexico
- 5.4.2 Europe
- 5.4.2.1 Germany
- 5.4.2.2 United Kingdom
- 5.4.2.3 Norway
- 5.4.2.4 Netherlands
- 5.4.2.5 Russia
- 5.4.2.6 Rest of Europe
- 5.4.3 Asia-Pacific
- 5.4.3.1 China
- 5.4.3.2 India
- 5.4.3.3 Japan
- 5.4.3.4 South Korea
- 5.4.3.5 ASEAN Countries
- 5.4.3.6 Australia
- 5.4.3.7 Rest of Asia Pacific
- 5.4.4 South America
- 5.4.4.1 Brazil
- 5.4.4.2 Argentina
- 5.4.4.3 Colombia
- 5.4.4.4 Rest of South America
- 5.4.5 Middle East and Africa
- 5.4.5.1 Saudi Arabia
- 5.4.5.2 United Arab Emirates
- 5.4.5.3 Qatar
- 5.4.5.4 South Africa
- 5.4.5.5 Nigeria
- 5.4.5.6 Rest of Middle East and Africa
- 5.4.1 North America
6 Competitive Landscape
- 6.1 Market Concentration
- 6.2 Strategic Moves (M&A, Partnerships, PPAs)
- 6.3 Market Share Analysis (Market Rank/Share for key companies)
- 6.4 Company Profiles (includes Global level Overview, Market level overview, Core Segments, Financials as available, Strategic Information, Products & Services, and Recent Developments)
- 6.4.1 China Petroleum & Chemical Corp (Sinopec)
- 6.4.2 Exxon Mobil Corporation
- 6.4.3 Royal Dutch Shell plc
- 6.4.4 Saudi Arabian Oil Company (Saudi Aramco)
- 6.4.5 BP plc
- 6.4.6 TotalEnergies SE
- 6.4.7 China National Petroleum Corporation (CNPC)
- 6.4.8 Reliance Industries Limited
- 6.4.9 Indian Oil Corporation Limited
- 6.4.10 Chevron Corporation
- 6.4.11 Phillips 66 Company
- 6.4.12 Marathon Petroleum Corporation
- 6.4.13 Valero Energy Corporation
- 6.4.14 Petroleo Brasileiro S.A. (Petrobras)
- 6.4.15 ENI S.p.A.
- 6.4.16 PTT Public Company Limited
- 6.4.17 SK Innovation Co., Ltd.
- 6.4.18 Kuwait Petroleum Corporation
- 6.4.19 Lukoil PJSC
- 6.4.20 OMV Group
7 Market Opportunities & Future Outlook
- 7.1 White-space & Unmet-need Assessment

