PUBLISHER: Mordor Intelligence | PRODUCT CODE: 2124437

PUBLISHER: Mordor Intelligence | PRODUCT CODE: 2124437
United States Commercial Construction - Market Share Analysis, Industry Trends & Statistics, Growth Forecasts (2026 - 2031)
According to Mordor Intelligence, the United States commercial construction market size is estimated at USD 567.05 billion in 2026 and is projected to reach USD 723.25 billion by 2031 at a CAGR of 4.22% during the forecast period (2026-2031).
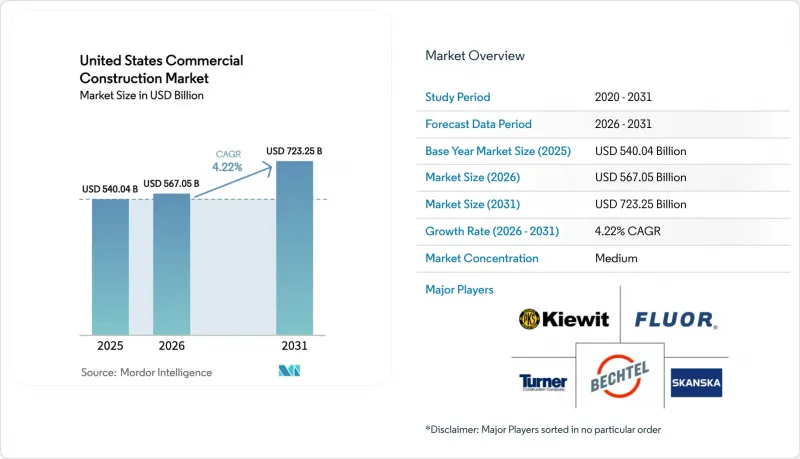
This report is Segmented by Commercial Sector Type (Office, Industrial & Logistics, and More), by Construction Type (New Construction and Renovation), by Investment Source (Private and Public), and by States (Texas, Florida, California, and More). The Report Offers Market Size and Forecasts in Value (USD) for all the Above Segments.
United States Commercial Construction Market Trends and Insights
E-Commerce Expansion Fuels Warehouse and Fulfillment Construction
E-commerce continues to steer location and product mix decisions as large retailers expand logistics footprints and push for speed-to-customer gains that require high-throughput facilities in core corridors. Amazon signed 31 million square feet of new leases in 2024, announced a USD 15 billion logistics expansion, adding nearly 80 facilities, and is positioned to capture around 25% of new industrial leasing in 2026. The U.S. delivered 146.6 million square feet of industrial space by mid-2025, with 341.8 million square feet under construction, while vacancy rose to 7.1% and signaled that supply was catching up to demand in select markets. Reshoring and nearshoring patterns amplify demand as 69% of U.S.-serving supply chains are projected to be Americas-based by 2026, up from 59%, supported by stronger U.S.-Mexico trade flows since 2018 and an upswing in nearshoring investment during early 2025. Within cold-chain logistics, online grocery is set to reach USD 100 billion in 2025, yet the nation's 220 million square feet of refrigerated space trails demand by 75-100 million square feet, a gap that is prompting large-scale investments like New Cold's USD 300 million expansion in Lebanon, Indiana. This divergence between standard warehouses and temperature-controlled facilities is sustaining rent premiums for specialized assets and rewarding developers with vertical integration or in-house MEP capabilities that manage complexity and cost.
Hybrid Workplace Pressures Drive Office Retrofit and Adaptive Reuse
Corporate occupiers are channeling capital into quality over quantity to support hybrid models, wellness, and energy performance in their workspaces. Only 14% of the global workforce prefers a traditional corporate office, while 60% of organizations plan to increase spending on design, fit-out, and refurbishment, a shift that favors adaptive reuse and targeted upgrades. Retrofit pathways can cost 30-50% less than ground-up builds and speed occupancy, illustrated by JPMorgan's 270 Park Avenue, a 2.5 million square foot all-electric skyscraper delivered in October 2025 that demonstrates high-performance design at scale. Conversion economics are strengthening as Gensler estimates around 34% of US office buildings can be repurposed to residential use at 30-40% below new-build costs, with Historic Tax Credits mobilizing billions in private capital for older downtown assets. Even as the national office vacancy rate reached 18.6% in late 2025, LEED-certified Class A properties command rent premiums that reinforce the business case for high-performance retrofits and high-quality tenant improvements. These dynamics keep retrofit pipelines active and position adaptive reuse as a resilient lever in the US commercial construction market through the forecast window.
Skilled Labor Shortages and Wage Pressure Slowing Project Delivery and Increasing Costs
Meeting 2026 demand requires recruiting 499,000 new workers after a shortfall year where most firms reported difficulty filling craft roles and an aging workforce pointed to higher retirements through the decade. Employers report the tightest gaps in specialized trades and estimating, which creates scheduling bottlenecks and increases reliance on overtime, incentives, and per diem policies that push project labor costs higher. Average hourly earnings in construction reached USD 38.76 by March 2025 and were up 4.5% year over year, while the sector paid more than manufacturing and transportation to compete for talent and retain crews on critical paths. Mission-critical work, such as data centers, pays premium rates that can pull electricians and HVAC technicians off other commercial sites and exacerbate staffing challenges for hospitals, schools, and civic projects. These pressures are broad-based, and they have led to measurable delays and potential output losses that reinforce the case for prefabrication, improved field productivity tools, and targeted training pipelines.
Other drivers and restraints analyzed in the detailed report include:
- Data Center Construction Accelerates Amid AI and Cloud Compute Demand
- Public Infrastructure Investment Sparks Transit-Adjacent Commercial Growth
- Financing Constraints and Loan Maturities Slow Speculative Development
For complete list of drivers and restraints, kindly check the Table Of Contents.
Segment Analysis
Office construction held 35.1% of the US commercial construction market share in 2025, supported by hybrid workplace upgrades and adaptive reuse strategies that often deliver occupancy sooner and at lower cost than new towers. Growth is uneven across office segments as companies prioritize high-performance buildings with modern systems and certifications that align with tenant expectations and ESG commitments. Within the US commercial construction industry, the industrial and logistics segment is the fastest-growing, with a 5.44% CAGR through 2031 as fulfillment needs, reshoring momentum, and cold-chain expansion continue to absorb new space and sustain build-to-suit activity. Developers are tracking the split between commodity warehouses and specialized facilities such as temperature-controlled storage and high-power data centers that command premium rents but require early procurement and more complex MEP coordination. This segmentation is converging near rail, highway, and power infrastructure, further tightening site selection filters in core markets.
The demand profile is reinforced by Amazon's multi-year expansion and broader leasing momentum among third-party logistics, which shape land prices, entitlement timelines, and construction schedules in high-growth corridors. Industrial deliveries and the pipeline reported by mid-2025 were high by historical standards, while vacancy increases indicated a healthier balance in certain submarkets that may moderate rent growth but still favor well-located assets. Data center spending is projected to peak at USD 89 billion in 2026 and has become a core driver of mission-critical work that shapes contractor backlogs and subtrade availability. These conditions keep industrial and logistics at the center of the US commercial construction market, with risk management focused on grid access, long-lead equipment, and entitlements for large-format projects.
Complete Report Scope:
- By Commercial Sector Type
- Office
- Retail
- Industrial & Logistics
- Others
- By Construction Type
- New Construction
- Renovation
- By Investment Source
- Public
- Private
- By States
- Texas
- California
- Florida
- New York
- Illinois
- Rest of US
List of Companies Covered in this Report:
- Turner Construction Company
- The Whiting-Turner Contracting Company
- STO Building Group
- DPR Construction
- Clark Construction Group
- Gilbane Building Company
- PCL Construction
- Hensel Phelps
- JE Dunn Construction
- McCarthy Building Companies
- Mortenson
- Lendlease (US)
- Balfour Beatty US
- HITT Contracting
- Webcor
- Layton Construction
- Pepper Construction
- Brasfield & Gorrie
- Ryan Companies US
- Swinerton
- The Walsh Group
- Holder Construction
Additional Benefits:
- The market estimate (ME) sheet in Excel format
- 3 months of analyst support
TABLE OF CONTENTS
1 Introduction
- 1.1 Study Assumptions & Market Definition
- 1.2 Scope of the Study
2 Research Methodology
3 Executive Summary
4 Market Landscape
- 4.1 Market Overview
- 4.2 Market Drivers
- 4.2.1 E-commerce expansion is fueling build-outs of warehouses, distribution centers, and fulfillment hubs.
- 4.2.2 Office retrofit and redevelopment is rising as employers seek more modern, hybrid-ready workplaces.
- 4.2.3 Data center growth is accelerating with new AI, cloud, and edge computing infrastructure.
- 4.2.4 Hospitality and mixed-use projects are recovering, driven by strong travel and retail demand.
- 4.2.5 Public investment in transit and civic facilities is sparking construction in infrastructure-adjacent zones.
- 4.2.6 Green-building and ESG focus is driving new commercial developments toward certified designs.
- 4.3 Market Restraints
- 4.3.1 Skilled labor shortages and wage pressure are slowing project delivery and increasing costs.
- 4.3.2 High material and freight inflation is compressing margins and delaying budgets.
- 4.3.3 Tight lending conditions and rising interest rates are hindering financing of speculative projects.
- 4.3.4 Permitting delays and zoning restrictions are prolonging pre-construction phases.
- 4.4 Value / Supply-Chain Analysis
- 4.4.1 Overview
- 4.4.2 Real Estate Developers and Contractors - Key Quantitative and Qualitative Insights
- 4.4.3 Architectural and Engineering Companies - Key Quantitative and Qualitative Insights
- 4.4.4 Building Material and Equipment Companies - Key Quantitative and Qualitative Insights
- 4.5 Government Initiatives and Vision
- 4.6 Regulatory Landscape
- 4.7 Technological Outlook
- 4.8 Porter's Five Forces
- 4.8.1 Competitive Rivalry
- 4.8.2 Threat of New Entrants
- 4.8.3 Threat of Substitutes
- 4.8.4 Bargaining Power of Suppliers
- 4.8.5 Bargaining Power of Buyers
- 4.9 Pricing (Construction Materials) and Construction Cost (Materials, Labour, Equipment) Analysis
- 4.10 Comparison of Key Industry Metrics of United States with Other Countries
- 4.11 Key Upcoming/Ongoing Projects (with a focus on Mega Projects)
5 Market Size & Growth Forecasts (Value, In USD)
- 5.1 By Commercial Sector Type
- 5.1.1 Office
- 5.1.2 Retail
- 5.1.3 Industrial & Logistics
- 5.1.4 Others
- 5.2 By Construction Type
- 5.2.1 New Construction
- 5.2.2 Renovation
- 5.3 By Investment Source
- 5.3.1 Public
- 5.3.2 Private
- 5.4 By States
- 5.4.1 Texas
- 5.4.2 California
- 5.4.3 Florida
- 5.4.4 New York
- 5.4.5 Illinois
- 5.4.6 Rest of US
6 Competitive Landscape
- 6.1 Market Concentration
- 6.2 Strategic Moves
- 6.3 Market Share Analysis
- 6.4 Company Profiles {(includes Global level Overview, Market level overview, Core Segments, Financials as available, Strategic Information, Market Rank/Share for key companies, Products & Services, and Recent Developments)}
- 6.4.1 Turner Construction Company
- 6.4.2 The Whiting-Turner Contracting Company
- 6.4.3 STO Building Group
- 6.4.4 DPR Construction
- 6.4.5 Clark Construction Group
- 6.4.6 Gilbane Building Company
- 6.4.7 PCL Construction
- 6.4.8 Hensel Phelps
- 6.4.9 JE Dunn Construction
- 6.4.10 McCarthy Building Companies
- 6.4.11 Mortenson
- 6.4.12 Lendlease (US)
- 6.4.13 Balfour Beatty US
- 6.4.14 HITT Contracting
- 6.4.15 Webcor
- 6.4.16 Layton Construction
- 6.4.17 Pepper Construction
- 6.4.18 Brasfield & Gorrie
- 6.4.19 Ryan Companies US
- 6.4.20 Swinerton
- 6.4.21 The Walsh Group
- 6.4.22 Holder Construction
7 Market Opportunities & Future Outlook
- 7.1 White-space & unmet-need assessment

