PUBLISHER: Mordor Intelligence | PRODUCT CODE: 2125686

PUBLISHER: Mordor Intelligence | PRODUCT CODE: 2125686
Europe Data Center Construction - Market Share Analysis, Industry Trends & Statistics, Growth Forecasts (2026 - 2031)
According to Mordor Intelligence, the Europe data center construction market size stands at USD 63.66 billion in 2026 and is projected to reach USD 93.03 billion by 2031, advancing at a 7.88% CAGR over the forecast period.
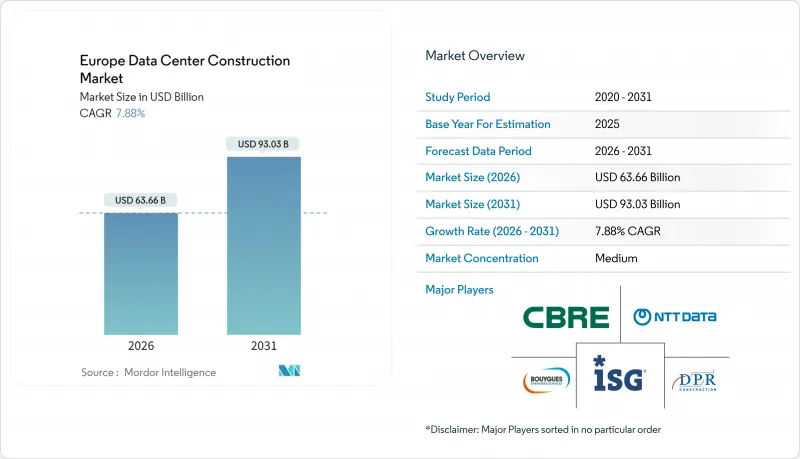
This report is Segmented by Tier Type (Tier 1 and 2, Tier 3, and Tier 4), Data Center Size (Small, Medium, Large, and Hyperscale), Data Center Type (Colocation, Hyperscalers/Cloud Service Providers, and Enterprise and Edge), Infrastructure (Electrical, Mechanical, General Construction, and Services). The Market Forecasts are Provided in Terms of Value (USD).
Europe Data Center Construction Market Trends and Insights
Rising Generative-AI and Big-Data Workloads
GPU clusters that draw 50-100 kilowatts per rack are redefining design baselines, prompting operators to deploy liquid-cooled racks across flagship campuses. Microsoft's Swedish facilities reached power-usage-effectiveness ratios below 1.2 in 2024, a threshold unattainable with air cooling. Training runs for frontier models run uninterrupted for weeks, pushing demand for Tier 4 fault-tolerant architectures despite a 20-30% cost premium. Enterprises that cannot meet latency targets in public clouds are retrofitting on-premises sites, accelerating orders for N+2 cooling loops and 400-volt uninterruptible power supplies. Generative-AI workloads are expected to dominate incremental capacity additions late in the decade, reshaping procurement toward high-density server enclosures. The shift also sharpens focus on grid resiliency, driving interest in on-site battery storage to mitigate brownouts during training cycles.
Surge in Hyperscale and Colocation Build-Outs
Hyperscale operators are consolidating loads into multi-campus estates that clear 1 gigawatt of IT capacity, enabling bulk renewable power purchase agreements at below-spot pricing. Amazon Web Services' EUR 7.8 billion Brandenburg program spans three sites totaling 1.2 gigawatts, locking in long-term grid reservations. Colocation specialists respond with powered-shell leases that let tenants fit bespoke cooling and network fabrics, a model Colt Data Centre Services advanced through EUR 2 billion (USD 2.4 billion) in German expansions in 2024. Average facility size for 2025 deliveries rose to 45 megawatts, up from 28 megawatts in 2020, intensifying demand for contractors capable of integrating modular power rooms at scale. The economies of scale also unlock cross-campus redundancy schemes, trimming reserve-capacity over-provisioning. These dynamics collectively boost construction intensity even in secondary metros such as Madrid and Milan.
Escalating Power and Real-Estate Costs
Industrial electricity in Germany and the United Kingdom averaged EUR 0.15-0.25 (USD 0.18-0.30) per kilowatt-hour in 2025, translating into USD 11.9-19.8 million in annual power costs for a 10-megawatt site operating at 80% utilization. Frankfurt land crossed EUR 1,200 per square meter in 2025, up 40% from 2022, as operators chase parcels with pre-existing grid access. The United Kingdom's property tax formula, pegged to replacement cost, adds USD 10-15 million per year to a 20-megawatt build. These pressures divert investment toward lower-cost secondary metros and drive the popularity of multi-year renewable PPAs in the Nordics, where wholesale rates sit below EUR 0.06 per kilowatt-hour. Developers are also pivoting to vertical data halls and rooftop solar canopies to stretch constrained footprints, though such adaptations increase structural steel tonnage and upfront capital costs.
Other drivers and restraints analyzed in the detailed report include:
- Cloud Service Provider Regional Expansion
- EU Green Deal Waste-Heat Reuse Incentives
- Grid-Connection Approval Bottlenecks
For complete list of drivers and restraints, kindly check the Table Of Contents.
Segment Analysis
Tier 3 captured 57.14% of Europe data center construction market spending in 2025, reflecting its balance between budget and uptime. Europe data center construction market size allocated to Tier 4 is growing at an 8.42% CAGR as financial services and government tenants press for 99.995% availability. Fault-tolerant 2N+1 redundancy eliminates single points of failure, a prerequisite for instant-settlement payment rails and defense command systems. Operators absorb the 20-30% capex premium because downtime penalties far outweigh initial costs. Frankfurt and London see the heaviest Tier 4 demand, though grid capacity constraints are redirecting projects to Brandenburg and Wales. Modular switchgear and hot-swappable UPS skids are standardizing Tier 4 deployments, trimming engineering cycles. Cloud providers experimenting with hybrid designs - Tier 4 for power and Tier 3 for cooling - reflect a nuanced risk-tiering strategy.
Tier 1 and Tier 2 builds fell below 10% of Europe data center construction market share in 2025 as operators abandon non-redundant layouts. Small and medium enterprises still accept Tier 3 colocation suites on cost grounds, but rising AI inference loads may stretch those architectures. European insurers are adding premium surcharges for Tier 3 outages, accelerating migration to higher tiers. Meanwhile, EU taxonomy rules favoring fault tolerance for critical infrastructure tilt financing toward Tier 4 bonds. Component vendors respond with pre-certified Tier 4 kits, compressing commissioning to under 20 months. The interplay between generative-AI density and uptime risk thus reinforces the Tier 4 trajectory.
Hyperscale campuses secured 60.75% of Europe data center construction market size in 2025, advancing at an 8.23% CAGR through 2031. Facilities in the 50-250 megawatt bracket let operators bargain for multi-gigawatt renewable PPAs, smoothing energy cost curves. Europe data center construction market share for hyperscale builds benefits from consolidation economies, particularly in power shell and heat-exchanger procurement. Brandenburg, Groningen, and Vasteras headline deal flow, where local governments fast-track permits for large-scale renewable integrations. Investors prize the predictable cash flows of hyperscale anchor leases, lowering weighted average cost of capital against smaller formats.
Large (10-50 megawatt) and medium (2-10 megawatt) facilities retain a role in regional aggregation networks, feeding edge nodes while providing burst capacity. Edge and micro-edge sites under 2 megawatts proliferate in urban cores to guarantee sub-20-millisecond latency for autonomous vehicles and industrial-IoT telemetry. Prefabricated container modules, deployable on retail-park car lots, compress construction to 12-18 months. Average hyperscale project scope climbed from 28 megawatts in 2020 to 45 megawatts in 2025, a trend likely to continue as chip roadmaps push thermal envelopes upward. Google's Groningen campus targets 200 megawatts at full build, illustrating the trajectory.
Complete Report Scope:
- By Tier Type
- Tier 1 and 2
- Tier 3
- Tier 4
- By Data Center Size
- Small
- Medium
- Large
- Hyperscale
- By Data Center Type
- Colocation Data Center
- Hyperscalers/Cloud Service Provider (CSPs)
- Enterprise and Edge Data Center
- By Infrastructure
- Electrical Infrastructure
- Power Distribution Solution
- Power Backup Solutions
- Mechanical Infrastructure
- Cooling Systems
- Racks and Cabinets
- Servers and Storage
- Other Mechanical Infrastructure
- General Construction
- Services - Design and Consulting, Integration, Support and Maintenance
- Electrical Infrastructure
- By Country
- Germany
- United Kingdom
- France
- Italy
- Spain
- Rest of Europe
List of Companies Covered in this Report:
- AECOM
- NTT Ltd.
- Rider Levett Bucknall LLP
- The Whiting-Turner Contracting Co.
- Jacobs Solutions Inc.
- DPR Construction
- Collen Construction Ltd.
- Mercury Engineering Unlimited Co.
- Hensel Phelps Construction Co.
- Hochtief AG
- Gilbane Building Co.
- Vinci Construction
- Clune Construction Co. LP
- Bouygues Energies and Services SAS
- CBRE Group Inc.
- Fluor Corp.
- ISG plc
- Skanska AB
- Arup Group Ltd.
- Lendlease Corporation Ltd.
Additional Benefits:
- The market estimate (ME) sheet in Excel format
- 3 months of analyst support
TABLE OF CONTENTS
1 INTRODUCTION
- 1.1 Study Assumptions and Market Definition
- 1.2 Scope of the Study
2 RESEARCH METHODOLOGY
3 EXECUTIVE SUMMARY
4 MARKET LANDSCAPE
- 4.1 Market Overview
- 4.2 Market Drivers
- 4.2.1 Rising Generative-AI and Big-Data Workloads
- 4.2.2 Surge in Hyperscale and Colocation Build-Outs
- 4.2.3 Cloud Service Provider Regional Expansion
- 4.2.4 EU Green Deal Waste-Heat Reuse Incentives
- 4.2.5 Nordic Renewable-Energy PPAs Lowering TCO
- 4.2.6 Prefabricated Modular Power Rooms Adoption
- 4.3 Market Restraints
- 4.3.1 Escalating Power and Real-Estate Costs
- 4.3.2 Grid-Connection Approval Bottlenecks
- 4.3.3 Stricter EU Taxonomy on Non-Green Materials
- 4.3.4 Skilled-Labour Gap for Advanced Commissioning
- 4.4 Industry Supply-Chain Analysis
- 4.5 Regulatory Landscape
- 4.6 Technological Outlook
- 4.7 Porter's Five Forces Analysis
- 4.7.1 Bargaining Power of Suppliers
- 4.7.2 Bargaining Power of Consumers
- 4.7.3 Threat of New Entrants
- 4.7.4 Threat of Substitutes
- 4.7.5 Intensity of Competitive Rivalry
- 4.8 Key Data Center Statistics
- 4.8.1 Exhaustive Data Center Operators in Europe (in MW)
- 4.8.2 List of Major Upcoming Data Center Projects in Europe (2025-2030)
- 4.8.3 CAPEX and OPEX For Europe Data Center Construction
- 4.8.4 Data Center Power Capacity Absorption In MW, Selected Cities, Europe, 2023 and 2024
- 4.9 Artificial Intelligence (AI) Inclusion in Data Center Construction in Europe
- 4.10 Regulatory and Compliance Framework
- 4.11 Impact of Macroeconomic Factors on the Market
5 MARKET SIZE AND GROWTH FORECASTS (VALUE)
- 5.1 By Tier Type
- 5.1.1 Tier 1 and 2
- 5.1.2 Tier 3
- 5.1.3 Tier 4
- 5.2 By Data Center Size
- 5.2.1 Small
- 5.2.2 Medium
- 5.2.3 Large
- 5.2.4 Hyperscale
- 5.3 By Data Center Type
- 5.3.1 Colocation Data Center
- 5.3.2 Hyperscalers/Cloud Service Provider (CSPs)
- 5.3.3 Enterprise and Edge Data Center
- 5.4 By Infrastructure
- 5.4.1 Electrical Infrastructure
- 5.4.1.1 Power Distribution Solution
- 5.4.1.2 Power Backup Solutions
- 5.4.2 Mechanical Infrastructure
- 5.4.2.1 Cooling Systems
- 5.4.2.2 Racks and Cabinets
- 5.4.2.3 Servers and Storage
- 5.4.2.4 Other Mechanical Infrastructure
- 5.4.3 General Construction
- 5.4.4 Services - Design and Consulting, Integration, Support and Maintenance
- 5.4.1 Electrical Infrastructure
- 5.5 By Country
- 5.5.1 Germany
- 5.5.2 United Kingdom
- 5.5.3 France
- 5.5.4 Italy
- 5.5.5 Spain
- 5.5.6 Rest of Europe
6 COMPETITIVE LANDSCAPE
- 6.1 Market Concentration
- 6.2 Strategic Moves
- 6.3 Market Share Analysis
- 6.4 Data Center Infrastructure Investment Based on Megawatt (MW) Capacity, 2024 vs 2030
- 6.5 Data Center Construction Landscape (Key Vendors Listings)
- 6.6 Company Profiles (includes Global Level Overview, Market Level Overview, Core Segments, Financials as Available, Strategic Information, Market Rank/Share for Key Companies, Products and Services, Recent Developments)
- 6.6.1 AECOM
- 6.6.2 NTT Ltd.
- 6.6.3 Rider Levett Bucknall LLP
- 6.6.4 The Whiting-Turner Contracting Co.
- 6.6.5 Jacobs Solutions Inc.
- 6.6.6 DPR Construction
- 6.6.7 Collen Construction Ltd.
- 6.6.8 Mercury Engineering Unlimited Co.
- 6.6.9 Hensel Phelps Construction Co.
- 6.6.10 Hochtief AG
- 6.6.11 Gilbane Building Co.
- 6.6.12 Vinci Construction
- 6.6.13 Clune Construction Co. LP
- 6.6.14 Bouygues Energies and Services SAS
- 6.6.15 CBRE Group Inc.
- 6.6.16 Fluor Corp.
- 6.6.17 ISG plc
- 6.6.18 Skanska AB
- 6.6.19 Arup Group Ltd.
- 6.6.20 Lendlease Corporation Ltd.
- 6.7 List of Data Center Construction Companies
7 MARKET OPPORTUNITIES AND FUTURE OUTLOOK
- 7.1 White-Space and Unmet-Need Assessment

