PUBLISHER: Mordor Intelligence | PRODUCT CODE: 2157141

PUBLISHER: Mordor Intelligence | PRODUCT CODE: 2157141
Indonesia 3PL Warehousing - Market Share Analysis, Industry Trends & Statistics, Growth Forecasts (2026 - 2031)
According to Mordor Intelligence, the Indonesia 3PL warehousing market size was valued at USD 3.26 billion in 2025 and is estimated to grow from USD 3.57 billion in 2026 to reach USD 5.51 billion by 2031, at a CAGR of 9.10% during the forecast period 2026-2031.
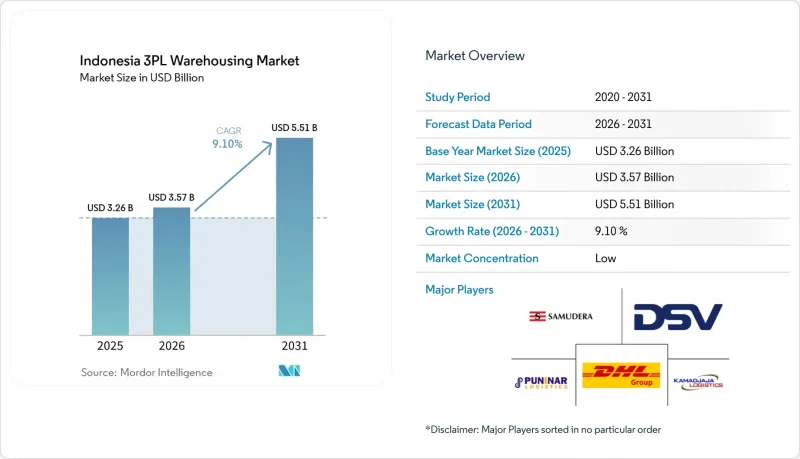
The Indonesia 3PL warehousing market is being shaped by e-commerce demand, manufacturing investment, and wider use of outsourced logistics services. This report is Segmented by Service Type (Storage, Distribution, and More), by Warehouse Type (Dedicated, Bonded, and More), by Temperature Control (Non-Temperature, Temperature), by Technology Adoption (Manual, Semi-Automated, and More), by End User Industry (Manufacturing, Consumer Goods, and More), and by Region (Java, Sumatra, and More). The Market Forecasts are Provided in Terms of Value (USD).
Indonesia 3PL Warehousing Market Trends and Insights
E-Commerce Growth Accelerating Omnichannel Warehousing Demand
Indonesia's e-commerce gross merchandise value reached USD 71 billion in 2025 and is estimated to approach USD 140 billion by 2030, increasing the inventory-management burden on logistics networks. The larger online retail base requires sellers to keep a broader range of products available while meeting customer expectations for speed and order accuracy. Marketplace sellers need stock positioned closer to consumers, which supports a shift from centralized hubs to networks that include secondary fulfillment locations. Greater Jakarta's modern logistics warehouse occupancy reached 98% in Q1 2026, showing that existing modern capacity on Java is under pressure. This occupancy level directs development toward adjacent corridors such as Karawang and Subang, where providers can still link facilities with Jakarta's consumer and port networks. Returns handling is also adding operational work because retailers need facilities that can inspect, sort, repack, and return goods to available inventory.
Industrial Expansion Increasing Modern Warehousing Requirements
Manufacturing investment is increasing the need for warehouses designed for specific supply chains and production schedules. Warehouse space inquiries in 2025 were led by the electric vehicle ecosystem and its suppliers, which often need specialized facility layouts. These customers may require controlled staging areas, customs-linked processes, and close access to factories that operate on planned delivery cycles. Modern logistics warehouse supply in Greater Jakarta reached 3.2 million m2 in Q1 2026, with new capacity concentrated in the Bekasi, Karawang, and Cikarang corridor. ESR and Indonesia Investment Authority began development of ESR Cikarang Logistics Park 4 in August 2026 at Jababeka Industrial Estate. The project is intended to serve global 3PL operators and multinational manufacturers.
Inter-Island Transshipment Reducing Warehousing Network Efficiency
Serving more than 17,000 islands requires transfers between road, port, vessel, regional port, and final delivery networks. Each transfer adds coordination work and creates more points where cargo schedules can change. This process adds 2-4 days of transit time and related cost when compared with mainland markets of similar scale. PELNI and Meratus Line signed a cooperation agreement in April 2026 for hub-and-spoke cargo services on Sea Toll routes S4A and S4B. The agreement supports cargo consolidation for Eastern Indonesia, but service quality still depends on vessel capacity, schedule reliability, and port dwell times. 3PL providers need to hold more safety stock at regional nodes to manage variability, which raises carrying costs.
Other drivers and restraints analyzed in the detailed report include:
- Cold-Chain Demand Expanding Temperature-Controlled Warehousing Capacity
- EV and Electronics Growth Boosting Warehouse Utilization
- Refrigeration Energy Costs Increasing Warehouse Operating Expenses
For complete list of drivers and restraints, kindly check the Table Of Contents.
Segment Analysis
Storage held 47.43% of Indonesia 3PL warehousing market share in 2025, while value-added services and others are forecast to record a 10.98% CAGR from 2026 to 2031, highlighting the continued importance of storage alongside the increasing use of value-added activities. Storage provides the physical inventory position from which customers can organize replenishment, order handling, and outbound distribution. Value-added services include kitting, labeling, co-packing, product preparation, and returns processing. These tasks are becoming more important as retailers seek fulfillment partners that can adjust products and orders closer to final delivery. The Indonesia 3PL warehousing industry is therefore moving beyond storage alone toward activities that prepare inventory for sale.
Distribution and inventory management connect stored goods with transport and last-mile delivery networks. FMCG and retail customers need these services because inventory moves frequently between warehouses, stores, and consumer delivery channels. E-commerce sellers also need facilities that can reposition stock when demand changes across cities and islands. Warehouse management systems support this work by improving visibility of individual stock-keeping units and available storage locations. The service mix becomes more useful when a provider can coordinate storage, handling, and dispatch within a single operating process.
General shared, or multi-client warehousing, held 49.32% of the Indonesia 3PL warehousing market size in 2025, while bonded warehousing is forecast to record an 11.63% CAGR from 2026 to 2031, reflecting the continued role of shared facilities alongside increasing demand for customs-controlled storage. General shared, or multi-client warehousing, gives shippers access to professional capacity without the fixed commitment needed for a dedicated facility. It also allows operators to pool infrastructure, labor, and handling resources across customers with changing volumes. The model fits a large base of small and medium-sized manufacturers that have varied storage requirements. Bonded warehousing is increasingly linked to export-oriented manufacturing, controlled storage, and customs procedures for international trade.
Maersk Logistics Indonesia received bonded logistics center approval for its Semarang facility in August 2026. The facility had an initial investment of IDR 13.04 billion (USD 0.78 million) serving apparel, footwear, and luggage exports to Europe. This example shows how bonded facilities can combine customs administration with warehousing services for exporters. Dedicated Contract Warehousing remains relevant to automotive and healthcare customers that require tailored layouts, defined processes, and service commitments. The Indonesia 3PL warehousing market, therefore, includes shared capacity, dedicated facilities, and bonded locations linked to export production.
Complete Report Scope:
- By Service Type
- Storage
- Distribution and Inventory Management
- Value-Added Services and Others (Kitting, Labeling)
- By Warehouse Type
- General Shared / Multi-client Warehousing
- Dedicated Contract Warehousing
- Bonded Warehousing
- By Temperature Control
- Non-Temperature Controlled
- Temperature Controlled
- By Technology Adoption
- Manual
- Semi-automated
- Fully Automated
- By End User Industry
- Manufacturing
- Consumer Goods
- Food and Beverage
- Retail and E-commerce
- Healthcare and Pharma
- Other End-user Industries
- By Region
- Java (Jakarta and BOD)
- Sumatra
- Kalimantan
- Sulawesi
- Bali and Nusa Tenggara
- Papua Region and Maluku Islands
List of Companies Covered in this Report:
- DHL Group
- DSV A/S
- Kuehne+Nagel International AG
- CMA CGM Group (CEVA Logistics)
- A.P. Moller - Maersk
- Nippon Express Holdings, Inc. (NX Group)
- Yusen Logistics Co., Ltd.
- Linfox
- CJ Logistics Corporation
- LOGISTEED, Ltd.
- Rhenus Group
- YCH Group
- PT Samudera Indonesia Tbk
- LINC Group
- PT Puninar Logistics
- PT Kamadjaja Logistics
- PT Cipta Krida Bahari
- Meratus Group
- Waresix
- Kiat Ananda Group
- PT BGR Logistik Indonesia
- PT Dunia Express Transindo
Additional Benefits:
- The market estimate (ME) sheet in Excel format
- 3 months of analyst support
TABLE OF CONTENTS
1 INTRODUCTION
- 1.1 Study Assumptions and Market Definition
- 1.2 Scope of the Study
2 RESEARCH METHODOLOGY
3 EXECUTIVE SUMMARY
- 3.1 Market Size, Growth, and Forecast Outlook
- 3.2 Key Demand Drivers and Warehousing Market Trends
- 3.3 Major Warehousing Hubs and Demand Concentration
- 3.4 Competitive Landscape and Leading 3PL Warehousing Providers
4 MARKET LANDSCAPE
- 4.1 Market Overview and Importance of Third-Party Logistics Warehousing
- 4.2 Market Drivers
- 4.2.1 E-commerce Growth Accelerating Omnichannel Warehousing Demand
- 4.2.2 Industrial Expansion Increasing Modern Warehousing Requirements
- 4.2.3 Inventory Outsourcing Driving Third-Party Warehousing Adoption
- 4.2.4 Cold-Chain Demand Expanding Temperature-Controlled Warehousing Capacity
- 4.2.5 Island Distribution Networks Increasing Decentralized Inventory Requirements
- 4.2.6 EV and Electronics Growth Boosting Warehouse Utilization
- 4.3 Market Restraints
- 4.3.1 Inter-Island Transshipment Reducing Warehousing Network Efficiency
- 4.3.2 Refrigeration Energy Costs Increasing Warehouse Operating Expenses
- 4.3.3 Limited Modern Capacity Constraining Warehousing Outside Java
- 4.3.4 Digital and Customs Integration Gaps Increasing Complexity
- 4.4 Value Chain Structure and 3PL Warehousing Flow Analysis
- 4.5 Regulatory Framework and Warehousing Compliance Requirements Analysis
- 4.6 Technology Adoption and Warehouse Digitalization Trend Analysis
- 4.7 Warehousing Operating Costs and Expenditure Structure Analysis
- 4.8 E-commerce Fulfillment and Distribution Network Development Analysis
- 4.9 Regional Warehouse Distribution and Business Concentration Analysis
- 4.10 Porter's Five Forces Analysis
- 4.10.1 Threat of New Entrants
- 4.10.2 Bargaining Power of Buyers
- 4.10.3 Bargaining Power of Suppliers
- 4.10.4 Threat of Substitute Services
- 4.10.5 Intensity of Competitive Rivalry
- 4.11 Impact of Geo-Political Events on Supply Chain Shifts
5 MARKET SIZE AND GROWTH FORECASTS
- 5.1 By Service Type
- 5.1.1 Storage
- 5.1.2 Distribution and Inventory Management
- 5.1.3 Value-Added Services and Others (Kitting, Labeling)
- 5.2 By Warehouse Type
- 5.2.1 General Shared / Multi-client Warehousing
- 5.2.2 Dedicated Contract Warehousing
- 5.2.3 Bonded Warehousing
- 5.3 By Temperature Control
- 5.3.1 Non-Temperature Controlled
- 5.3.2 Temperature Controlled
- 5.4 By Technology Adoption
- 5.4.1 Manual
- 5.4.2 Semi-automated
- 5.4.3 Fully Automated
- 5.5 By End User Industry
- 5.5.1 Manufacturing
- 5.5.2 Consumer Goods
- 5.5.3 Food and Beverage
- 5.5.4 Retail and E-commerce
- 5.5.5 Healthcare and Pharma
- 5.5.6 Other End-user Industries
- 5.6 By Region
- 5.6.1 Java (Jakarta and BOD)
- 5.6.2 Sumatra
- 5.6.3 Kalimantan
- 5.6.4 Sulawesi
- 5.6.5 Bali and Nusa Tenggara
- 5.6.6 Papua Region and Maluku Islands
6 COMPETITIVE LANDSCAPE
- 6.1 Market Concentration
- 6.2 Strategic Moves
- 6.3 Market Share Analysis
- 6.4 Company Profiles (includes Global Level Overview, Market Level Overview, Core Segments, Financials as available, Strategic Information, Geographic Coverage, Products and Services, Recent Developments)
- 6.4.1 DHL Group
- 6.4.2 DSV A/S
- 6.4.3 Kuehne+Nagel International AG
- 6.4.4 CMA CGM Group (CEVA Logistics)
- 6.4.5 A.P. Moller - Maersk
- 6.4.6 Nippon Express Holdings, Inc. (NX Group)
- 6.4.7 Yusen Logistics Co., Ltd.
- 6.4.8 Linfox
- 6.4.9 CJ Logistics Corporation
- 6.4.10 LOGISTEED, Ltd.
- 6.4.11 Rhenus Group
- 6.4.12 YCH Group
- 6.4.13 PT Samudera Indonesia Tbk
- 6.4.14 LINC Group
- 6.4.15 PT Puninar Logistics
- 6.4.16 PT Kamadjaja Logistics
- 6.4.17 PT Cipta Krida Bahari
- 6.4.18 Meratus Group
- 6.4.19 Waresix
- 6.4.20 Kiat Ananda Group
- 6.4.21 PT BGR Logistik Indonesia
- 6.4.22 PT Dunia Express Transindo
7 MARKET OPPORTUNITIES AND FUTURE OUTLOOK
- 7.1 White-Space Opportunities and Unmet Warehousing Service Needs
- 7.2 High-Potential End-User Segments and Growth Opportunities
- 7.3 Strategic Growth Priorities Across Warehousing Ecosystem
- 7.4 Future Market Outlook and Emerging Warehousing Demand Pockets
8 APPENDIX

