PUBLISHER: Mordor Intelligence | PRODUCT CODE: 2187333

PUBLISHER: Mordor Intelligence | PRODUCT CODE: 2187333
United States Freight Brokerage - Market Share Analysis, Industry Trends & Statistics, Growth Forecasts (2027 - 2032)
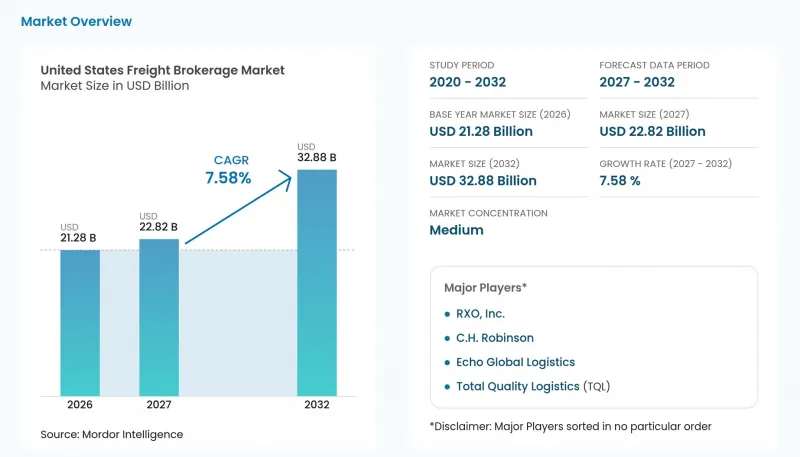
According to Mordor Intelligence, the United States freight brokerage market size was valued at USD 21.28 billion in 2026 and estimated to grow from USD 22.82 billion in 2027 to reach USD 32.88 billion by 2032, at a CAGR of 7.58% during the forecast period (2027-2032).
This report is segmented by Service (Full-Truckload and more), Equipment / Trailer Type (Dry Van and more), Haul Length (Long-Haul and more), Business Model (Traditional Freight Brokerage and more), End-User Industry (Retail, FMCG and Wholesale Distribution and more), Customer Size, and Geography. The market forecasts are provided in terms of value (USD), based on availability.
United States Freight Brokerage Market Trends and Insights
E-Commerce Volume Surge and Next-Day Delivery Expectations
Online retail expansion makes freight replenishment speed commercially consequential before the consumer delivery occurs. US retail e-commerce sales reached USD 340.2 billion in Q2 2026, up 12.2% (+-0.9%) from Q2 2025 on a seasonally adjusted, not price-adjusted basis. US Prime members received over 8 billion Amazon items the same or next day in 2025, over 30% above 2024. An AlixPartners online survey of 1,000 US consumers in 2026 found a maximum acceptable free-shipping delivery time of 2.6 days. Brokerage can support the upstream freight connections needed to replenish fulfillment operations serving such short windows. A retailer promising free delivery within 2.6 days has little room to absorb an uncovered replenishment load, so quick tendering and carrier coverage become the brokerage services that protect that promise.
Highly Fragmented Carrier Base Boosts Broker Relevance
A dispersed carrier base gives brokers a role in making small fleets commercially accessible to shippers. As of June 2025, nearly 580,000 active US motor carriers registered with the Federal Motor Carrier Safety Administration (FMCSA) owned or leased at least one tractor, and 91.5% operated 10 or fewer trucks. This distribution makes assembling coverage across separate fleets a different task from negotiating with a single transport provider. For shippers needing several lanes, brokerage can consolidate that search into one freight-arrangement relationship. The demand mechanism is access to dispersed capacity rather than an increase in the number of trucks. Securing another small fleet on a difficult lane can matter more to a shipper than a broader directory of carriers serving unrelated routes.
Spot-Rate Volatility Compressing Brokerage Margins
Spot-rate volatility constrains a broker's ability to price capacity confidently while preserving the gross margin on each load. Ken Adamo, EASE Logistics chief strategy officer and former DAT chief of analytics, reported DAT's June 2026 data linked volatility to margin dispersion, with nearly 20% of spot loads at negative gross margin. He put spot-load gross margins at just under 13.5%, down about 2 percentage points year over year, while describing the level as still healthy. For a broker pricing additional spot freight, that dispersion means an aggregate margin cannot establish whether the next load will cover its carrier cost. Buying capacity above the amount recoverable from the shipper creates a negative gross contribution, so additional loads can reduce returns rather than reward expansion.
Other drivers and restraints analyzed in the detailed report include:
- Rapid Digitization of TMS / API Integrations
- Shipper Demand for Carbon-Footprint-Optimized Routing
- Driver Shortage and Capacity Unpredictability
For complete list of drivers and restraints, kindly check the Table Of Contents.
Segment Analysis
Full-truckload (FTL) accounted for a 63.32% share of the United States freight brokerage market size in 2026, making it the largest segment. C.H. Robinson's North American Surface Transportation truckload volume increased 0.5% in Q2 2026 versus Q2 2025. In such a truckload operation, the broker must match each complete freight requirement to carrier availability as loads are added. As truckload activity expands, a shipper gains little from a lower quote unless the broker also secures a carrier for the entire load.
Less-than-truckload (LTL) is forecast to be the fastest-growing segment, at a 9.1% CAGR during 2027-2032. On September 14, 2026, Circle Logistics announced that it was expanding refrigerated LTL service for food and beverage shippers and building a frozen-producer referral network. The broker and 3PL serves the continental United States and Mexico and described consolidating multiple pallet shipments onto a single temperature-controlled trailer. For smaller producers, this structure can connect partial shipments to carrier capacity without the charge for an entire truck. Building the producer referral network can make several small orders jointly serviceable, so access to compatible co-loads becomes as consequential as access to a trailer.
Dry van represented a 44.41% United States freight brokerage market share in 2026, making it the largest segment. For the week ending October 17, 2026, DAT reported that dry-van load posts fell 6.0% and posted trucks slipped 0.5% week over week, while load posts were 23.4% above a year earlier. The load-to-truck ratio was 9.70, down from 10.27 the week before last but above 5.75 a year earlier, when posted trucks ran more than one-third higher. A broker pricing dry-van freight on DAT therefore faces a thinner posted-truck pool than a year earlier, limiting the reassurance that weekly easing offers about carrier coverage.
Refrigerated vans are forecast to be the fastest-growing segment, with a 10.2% CAGR during 2027-2032. On October 20, 2026, FreightWaves reported a national refrigerated truckload tender rejection rate of 21.44%, with fall-harvest produce and pre-Thanksgiving protein shipments tightening Pacific Northwest and Midwest capacity. Near-term volumes qualify the outlook, as USDA reported 7.76 million short tons of US fresh-produce truck shipments in Q1 2026, up 1% from Q4 2025 but down 10% from Q1 2025. Following its 2025 acquisition of Ohio refrigerated carrier Kandel Transport, Nagle Companies reported a combined fleet of 115 tractors and 200 trailers, with Kandel retaining its name and management and the combined operation serving Canada. Seasonal carrier refusals create a need for alternative refrigerated coverage even when produce tonnage is below its year-earlier level.
Complete Report Scope:
- By Service
- Full-Truckload (FTL)
- Less-than-Truckload (LTL)
- Others
- By Equipment / Trailer Type
- Dry Van
- Refrigerated Van
- Flatbed / Step-Deck
- Tanker (Bulk Liquid and Chemical)
- Others
- By Haul Length
- Long-Haul (More than 500 miles)
- Regional (100-500 miles)
- Local (Lesser than 100 miles)
- By Business Model
- Traditional Freight Brokerage
- Asset-Based Freight Brokerage
- Agent Model Freight Brokerage
- Digital Freight Brokerage
- By End-User Industry
- Manufacturing and Automotive
- Construction and Infrastructure Projects
- Oil, Gas, Mining and Chemicals
- Agriculture and Food / Beverage
- Retail, FMCG and Wholesale Distribution
- Healthcare and Pharmaceuticals
- E-commerce and 3PL Fulfillment
- Other End-User Industry
- By Customer Size
- Large Enterprise Shippers (Greater than USD 100 M)
- Mid-Market Shippers (USD 10-100 M)
- Small Businesses (Lesser than USD 10 M)
- By Geography
- Northeast
- Midwest
- Southeast
- Southwest
- West
List of Companies Covered in this Report:
- Allen Lund Company
- ArcBest Corporation
- Arrive Logistics
- BlueGrace Logistics
- BNSF Logistics
- C.H. Robinson
- Convoy Inc.
- Echo Global Logistics
- GlobalTranz (WWEX)
- Hub Group
- J.B. Hunt Transport Services, Inc.
- Landstar System, Inc.
- Mode Global
- Nolan Transportation Group
- Spot, Inc.
- Redwood Logistics
- Schneider FreightPlus
- SunteckTTS
- Total Quality Logistics (TQL)
- Trinity Logistics
- Uber Freight
- Worldwide Express
- RXO, Inc.
Additional Benefits:
- The market estimate (ME) sheet in Excel format
- 3 months of analyst support
TABLE OF CONTENTS
1 INTRODUCTION
- 1.1 Study Assumptions and Market Definition
- 1.2 Scope of the Study
2 RESEARCH METHODOLOGY
3 EXECUTIVE SUMMARY
4 MARKET LANDSCAPE
- 4.1 Market Overview
- 4.2 Market Drivers
- 4.2.1 E-Commerce Volume Surge and Next-Day Delivery Expectations
- 4.2.2 Highly Fragmented Carrier Base Boosts Broker Relevance
- 4.2.3 Rapid Digitization of TMS / API Integrations
- 4.2.4 Shipper Demand for Carbon-Footprint-Optimized Routing
- 4.2.5 PE-Backed Shipper Consolidation Outsourcing to Brokers
- 4.2.6 Nearshoring and US-Mexico Cross-Border Expansion
- 4.3 Market Restraints
- 4.3.1 Spot-Rate Volatility Compressing Brokerage Margins
- 4.3.2 Driver Shortage and Capacity Unpredictability
- 4.3.3 Compliance Costs from AB5, Speed-Limiter Proposals
- 4.3.4 Shipper Direct Contracting via Digital Load Boards
- 4.4 Industry Value Chain Analysis
- 4.5 Regulatory Landscape
- 4.6 Technological Outlook
- 4.7 Porter's Five Forces Analysis
- 4.7.1 Threat of New Entrants
- 4.7.2 Bargaining Power of Suppliers
- 4.7.3 Bargaining Power of Buyers
- 4.7.4 Threat of Substitutes
- 4.7.5 Competitive Rivalry
5 MARKET SIZE AND GROWTH FORECASTS (VALUE)
- 5.1 By Service
- 5.1.1 Full-Truckload (FTL)
- 5.1.2 Less-than-Truckload (LTL)
- 5.1.3 Others
- 5.2 By Equipment / Trailer Type
- 5.2.1 Dry Van
- 5.2.2 Refrigerated Van
- 5.2.3 Flatbed / Step-Deck
- 5.2.4 Tanker (Bulk Liquid and Chemical)
- 5.2.5 Others
- 5.3 By Haul Length
- 5.3.1 Long-Haul (More than 500 miles)
- 5.3.2 Regional (100-500 miles)
- 5.3.3 Local (Lesser than 100 miles)
- 5.4 By Business Model
- 5.4.1 Traditional Freight Brokerage
- 5.4.2 Asset-Based Freight Brokerage
- 5.4.3 Agent Model Freight Brokerage
- 5.4.4 Digital Freight Brokerage
- 5.5 By End-User Industry
- 5.5.1 Manufacturing and Automotive
- 5.5.2 Construction and Infrastructure Projects
- 5.5.3 Oil, Gas, Mining and Chemicals
- 5.5.4 Agriculture and Food / Beverage
- 5.5.5 Retail, FMCG and Wholesale Distribution
- 5.5.6 Healthcare and Pharmaceuticals
- 5.5.7 E-commerce and 3PL Fulfillment
- 5.5.8 Other End-User Industry
- 5.6 By Customer Size
- 5.6.1 Large Enterprise Shippers (Greater than USD 100 M)
- 5.6.2 Mid-Market Shippers (USD 10-100 M)
- 5.6.3 Small Businesses (Lesser than USD 10 M)
- 5.7 By Geography
- 5.7.1 Northeast
- 5.7.2 Midwest
- 5.7.3 Southeast
- 5.7.4 Southwest
- 5.7.5 West
6 COMPETITIVE LANDSCAPE
- 6.1 Market Concentration
- 6.2 Strategic Moves
- 6.3 Market Share Analysis
- 6.4 Company Profiles (includes Global level Overview, Market level overview, Core Segments, Financials as available, Strategic Information, Market Rank/Share for key companies, Products and Services, and Recent Developments)
- 6.4.1 Allen Lund Company
- 6.4.2 ArcBest Corporation
- 6.4.3 Arrive Logistics
- 6.4.4 BlueGrace Logistics
- 6.4.5 BNSF Logistics
- 6.4.6 C.H. Robinson
- 6.4.7 Convoy Inc.
- 6.4.8 Echo Global Logistics
- 6.4.9 GlobalTranz (WWEX)
- 6.4.10 Hub Group
- 6.4.11 J.B. Hunt Transport Services, Inc.
- 6.4.12 Landstar System, Inc.
- 6.4.13 Mode Global
- 6.4.14 Nolan Transportation Group
- 6.4.15 Spot, Inc.
- 6.4.16 Redwood Logistics
- 6.4.17 Schneider FreightPlus
- 6.4.18 SunteckTTS
- 6.4.19 Total Quality Logistics (TQL)
- 6.4.20 Trinity Logistics
- 6.4.21 Uber Freight
- 6.4.22 Worldwide Express
- 6.4.23 RXO, Inc.
7 MARKET OPPORTUNITIES AND FUTURE OUTLOOK
- 7.1 White-Space and Unmet-Need Assessment

