
PUBLISHER: Mordor Intelligence | PRODUCT CODE: 2063311

PUBLISHER: Mordor Intelligence | PRODUCT CODE: 2063311
Europe Freight Brokerage Services - Market Share Analysis, Industry Trends & Statistics, Growth Forecasts (2026 - 2031)
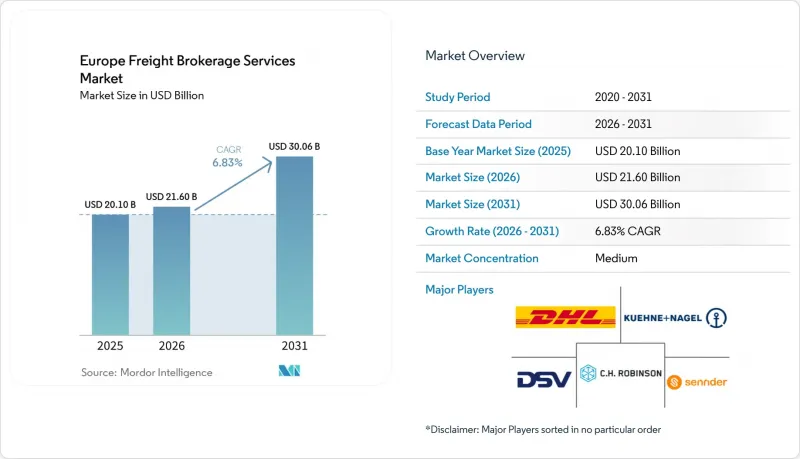
According to Mordor Intelligence, the europe freight brokerage market size is expected to increase from USD 20.10 billion in 2025 to USD 21.60 billion in 2026 and reach USD 30.06 billion by 2031, growing at a 6.83% CAGR over 2026-2031.
Manufacturing reshoring across Central Europe is re-routing freight volumes toward intra-EU lanes, while the EU-wide rollout of electronic consignment notes is accelerating transaction velocity and audit-trail transparency. This report is Segmented by Service (FTL, LTL), by Equipment (Dry, Refrigerated Van, and More), by Haul (Long-Haul, Regional, Local), by Business (Traditional, Asset-Based, and More), by End-User (Manufacturing & Automotive, Construction, and More), by Customer Size (Large, Mid-Market, Small Business), and by Country (Germany, UK, and More). The Market Forecasts are Provided in Terms of Value (USD).
Europe Freight Brokerage Services Market Trends and Insights
Reshoring-Driven Surge in Intra-EU Manufacturing Freight
Automotive and electronics producers are relocating capacity from Asia into Poland and Czechia, increasing round-trip hauls on east-west corridors. Waberer's recorded EUR 757.5 million (USD 892.5 million) revenue in 2024, up 6.5%, after adding rail logistics services that anchor just-in-time parts flows for factories in the Visegrad region. Brokers that can secure predictable capacity across these lanes gain pricing power because plant schedules tolerate minimal variance. However, they must also manage border-crossing rules on cabotage, driver work-hours, and CO2-based tolls, which differ by country.
EU-Wide Rollout of Electronic Freight Documents (eCMR)
Thirty-four European states now recognize eCMR as legal proof of delivery, trimming paperwork delays at borders and enabling brokers to bill faster. Transporeon embedded eCMR into its Freight Marketplace in April 2025, allowing forwarders to tender spot loads and capture electronic signatures in real time. For LTL brokers that juggle multiple hand-offs per trip, automated document workflows lower administrative costs per pallet and strengthen cash-flow cycles.
Diesel & AdBlue Price Volatility Compresses Brokerage Spreads
Fuel spikes narrow margins between fixed customer quotes and carrier invoices. Germany's new CO2-indexed truck toll compounds cost unpredictability, pushing brokers to introduce floating fuel surcharges that some shippers resist. Smaller intermediaries, unable to hedge exposure, are selling to well-capitalized groups.
Other drivers and restraints analyzed in the detailed report include:
- AI-Driven Dynamic Pricing Unlocks Hidden Lane Profitability
- Booming Cold-Chain Demand from mRNA and Biopharma Logistics
- EU Supply-Chain Due-Diligence Law Raises Compliance Overhead
For complete list of drivers and restraints, kindly check the Table Of Contents.
Segment Analysis
Full-truckload retained 58.45% of the Europe freight brokerage market share in 2025, anchored by predictable factory-to-DC routes and time-critical deliveries. Less-than-truckload, however, is projected to expand at 8.75% CAGR, propelled by e-commerce parcelization and the economics of load pooling that improve trailer fill rates. Digital platforms excel in LTL because algorithms identify consolidation points humans overlook, compressing pickup-to-delivery cycles.
Brokers increasingly run hybrid models, blending contracted FTL for predictable lanes with spot LTL to absorb surplus capacity. Pharmaceutical shippers often allocate ambient FTL but divert temperature-sensitive pallets into certified LTL networks to control cost, reinforcing the strategic need for brokers to manage both service types without breaking chain-of-custody protocols. As APIs proliferate, shippers expect instant access to both FTL and LTL quotes inside the same dashboard, further blurring operational boundaries inside the Europe freight brokerage market.
Dry vans delivered 41.66% of Europe freight brokerage market size, thanks to versatility and asset availability. Yet refrigerated vans are on a 9.57% CAGR trajectory through 2031 as vaccine, insulin, and fresh-food flows normalize at elevated baselines. The Brokers that validate reefer sensor data and provide exception dashboards earn premium margins because regulatory fines for temperature excursions can wipe out entire shipment profits.
Flatbed and step-deck trailers remain cyclical, tied to construction starts and infrastructure funding. Tanker demand grows modestly with chemicals and edible oils, but high safety training costs act as a barrier to entry. Specialization decisions therefore, hinge on whether brokers seek volume stability or margin premium, a trade-off increasingly visible as the Europe freight brokerage market diversifies cargo profiles.
List of Companies Covered in this Report:
- DHL Group
- C.H. Robinson
- EMO Trans
- XPO Inc.
- Kuehne+Nagel
- Sennder
- DSV A/S
- GEODIS
- CMA CGM Group (Including CEVA Logistics)
- Dachser
- Hellmann Worldwide Logistics
- Transporeon
- LKW WALTER
- Girteka Logistics
- Waberer's Group
- Ewals Cargo Care
- Rhenus Logistics
- Yusen Logistics (Part of NYK Line)
- Raben Group
- Scan Global Logistics
Additional Benefits:
- The market estimate (ME) sheet in Excel format
- 3 months of analyst support
TABLE OF CONTENTS
1 Introduction
- 1.1 Study Assumptions and Market Definition
- 1.2 Scope of the Study
2 Research Methodology
3 Executive Summary
4 Market Landscape
- 4.1 Market Overview
- 4.2 Market Drivers
- 4.2.1 Reshoring-driven surge in intra-EU manufacturing freight
- 4.2.2 EU-wide rollout of electronic freight documents (eCMR)
- 4.2.3 AI-driven dynamic pricing unlocks hidden lane profitability
- 4.2.4 Booming cold-chain demand from mRNA and biopharma logistics
- 4.2.5 Urban micro-fulfilment hubs fragment last-mile road legs
- 4.2.6 Venture-capital-fuelled consolidation among digital brokers
- 4.3 Market Restraints
- 4.3.1 Diesel & AdBlue price volatility compresses brokerage spreads
- 4.3.2 EU supply-chain due-diligence law raises compliance overhead
- 4.3.3 Escalating cyber-attacks erode shipper trust in digital platforms
- 4.3.4 Persisting cross-border toll heterogeneity inflates admin costs
- 4.4 Value / Supply-Chain Analysis
- 4.5 Regulatory Landscape
- 4.6 Technological Outlook
- 4.7 Porter's Five Forces
- 4.7.1 Threat of New Entrants
- 4.7.2 Bargaining Power of Buyers
- 4.7.3 Bargaining Power of Suppliers
- 4.7.4 Threat of Substitutes
- 4.7.5 Competitive Rivalry
5 Market Size and Growth Forecasts (Value, USD Bn)
- 5.1 By Service
- 5.1.1 Full-Truckload (FTL)
- 5.1.2 Less-than-Truckload (LTL)
- 5.1.3 Others
- 5.2 By Equipment / Trailer Type
- 5.2.1 Dry Van
- 5.2.2 Refrigerated Van
- 5.2.3 Flatbed / Step-Deck
- 5.2.4 Tanker (Bulk Liquid and Chemical)
- 5.2.5 Others
- 5.3 By Haul Length
- 5.3.1 Long-Haul (More than 500 miles)
- 5.3.2 Regional (100-500 miles)
- 5.3.3 Local (Less than 100 miles)
- 5.4 By Business Model
- 5.4.1 Traditional Freight Brokerage
- 5.4.2 Asset-Based Freight Brokerage
- 5.4.3 Agent Model Freight Brokerage
- 5.4.4 Digital Freight Brokerage
- 5.5 By End-User Industry
- 5.5.1 Manufacturing and Automotive
- 5.5.2 Construction and Infrastructure Projects
- 5.5.3 Oil, Gas, Mining and Chemicals
- 5.5.4 Agriculture and Food / Beverage
- 5.5.5 Retail, FMCG and Wholesale Distribution
- 5.5.6 Healthcare and Pharmaceuticals
- 5.5.7 E-commerce and 3PL Fulfilment
- 5.5.8 Other End-User Industry
- 5.6 By Customer Size
- 5.6.1 Large Enterprise Shippers (More than USD 100 M)
- 5.6.2 Mid-Market Shippers (USD 10-100 M)
- 5.6.3 Small Businesses (Less than USD 10 M)
- 5.7 By Country
- 5.7.1 Germany
- 5.7.2 United Kingdom
- 5.7.3 France
- 5.7.4 Italy
- 5.7.5 Spain
- 5.7.6 Netherlands
- 5.7.7 Belgium
- 5.7.8 Nordics (Sweden, Denmark, Norway, Finland)
- 5.7.9 Poland
- 5.7.10 Rest of Europe
6 Competitive Landscape
- 6.1 Market Concentration
- 6.2 Strategic Moves
- 6.3 Market Share Analysis
- 6.4 Company Profiles (includes Global level Overview, Market level overview, Core Segments, Financials as available, Strategic Information, Market Rank/Share for key companies, Products and Services, and Recent Developments)
- 6.4.1 DHL Group
- 6.4.2 C.H. Robinson
- 6.4.3 EMO Trans
- 6.4.4 XPO Inc.
- 6.4.5 Kuehne+Nagel
- 6.4.6 Sennder
- 6.4.7 DSV A/S
- 6.4.8 GEODIS
- 6.4.9 CMA CGM Group (Including CEVA Logistics)
- 6.4.10 Dachser
- 6.4.11 Hellmann Worldwide Logistics
- 6.4.12 Transporeon
- 6.4.13 LKW WALTER
- 6.4.14 Girteka Logistics
- 6.4.15 Waberer's Group
- 6.4.16 Ewals Cargo Care
- 6.4.17 Rhenus Logistics
- 6.4.18 Yusen Logistics (Part of NYK Line)
- 6.4.19 Raben Group
- 6.4.20 Scan Global Logistics
7 Market Opportunities and Future Outlook
- 7.1 White-space and Unmet-Need Assessment

