
PUBLISHER: Mordor Intelligence | PRODUCT CODE: 2063302

PUBLISHER: Mordor Intelligence | PRODUCT CODE: 2063302
Freight Brokerage Services - Market Share Analysis, Industry Trends & Statistics, Growth Forecasts (2026 - 2031)
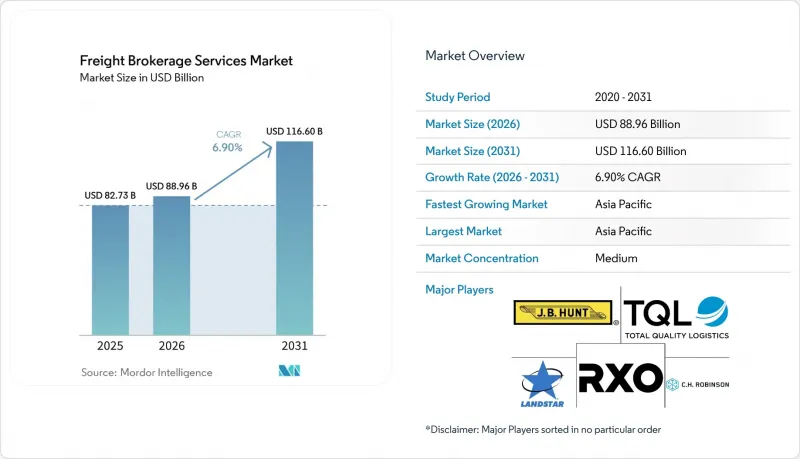
According to Mordor Intelligence, the freight brokerage services market size is expected to increase from USD 82.73 billion in 2025 to USD 88.96 billion in 2026 and reach USD 116.60 billion by 2031, growing at a CAGR of 6.90% over 2026-2031.
Nearshoring is shortening average haul lengths, omni-channel retail is fragmenting shipment lots, and mega-mergers between brokers and global 3PLs are redefining competitive boundaries. This report is Segmented by Service (Full-Truckload, and More), by Equipment/Trailer Type (Dry Van, Refrigerated Van, and More), by Haul Length (Long-Haul, Regional, Local), by Business Model (Traditional, Asset-Based, and More), by End-User Industry (Manufacturing & Auto, and More), by Customer Size (Large Enterprise, and More), and by Geography. The Market Forecasts are in Terms of Value (USD).
Global Freight Brokerage Services Market Trends and Insights
Nearshoring and Reshoring Shift Volumes Toward Cross-Border Short-Haul Corridors
Nearshoring and reshoring trends are reducing reliance on long-haul intercontinental routes and increasing the importance of cross-border short-haul corridors. Manufacturing shifts to regions like Mexico and Eastern Europe are shortening shipment distances while increasing shipment frequency and border-crossing volumes. This creates challenges in customs clearance, documentation, and compliance, elevating brokers' roles. Brokers with bilingual skills, compliance expertise, and integrated customs solutions, such as CARM-ready platforms, are better positioned to capture higher margins. Dual-qualified carrier networks and a focus on resilience over cost minimization further enhance brokers' competitive advantage, driving sustained demand in regional trade corridors .
Omni-Channel Retail Boom Intensifies Middle-Mile Brokerage Demand
The growth of omni-channel retail is reshaping logistics networks by emphasizing speed, flexibility, and inventory responsiveness. Retailers' commitments to same-day or next-day delivery require frequent replenishment of stores and fulfillment centers within tight timeframes, increasing the importance of middle-mile logistics. Freight brokers play a key role in optimizing routes and consolidating loads, aided by advanced routing algorithms that reduce empty miles and transportation costs. Digital platforms and real-time visibility tools are essential for managing high-frequency shipments, while dynamic demand-capacity matching enhances responsiveness during demand spikes. As inventory decentralization continues, brokerage services enabling efficient middle-mile operations are expected to see sustained growth and strategic importance .
Container-Rate Whiplash Compresses Spot-Margin Windows
Extreme volatility in container freight rates is causing significant margin uncertainty for freight brokers, particularly in short-cycle spot markets. Fluctuations of up to USD 5,000 in 40-foot container rates within weeks force brokers to frequently re-quote shipments, disrupting pricing consistency and increasing operational workload. In port-to-distribution center (DC) drayage lanes, where margins are already narrow, such changes can reduce gross margins by over 100 basis points. Brokers also face heightened counterparty risk when contracted rates diverge from market prices, with limited options for hedging or accurate forecasting. As a result, brokers are adopting dynamic pricing tools and shorter contract cycles, though these measures may not fully offset the impact of sustained volatility..
Other drivers and restraints analyzed in the detailed report include:
- SME Self-Service Portals Expand Long-Tail Customer Penetration
- Mega-Mergers Between Brokers and Global 3PLs Unlock One-Stop Capacity Networks
- Inventory Destocking Post-Pandemic Dampens Shipment Volumes 2024-2026
For complete list of drivers and restraints, kindly check the Table Of Contents.
Segment Analysis
Less-than-Truckload shipments are expanding at a 10.05% CAGR, lifting the freight brokerage services market as retailers shift to SKU-level replenishment and shared-truckload programs push trailer cube utilization to 92%. Multi-stop algorithms widen broker gross margin to 16% on consolidated routes, while Full-Truckload continues to anchor 67.15% market share but sees its freight brokerage services market share decline two percentage points as shippers diversify modes and demand flexible capacity options.
Brokers protect legacy FTL contracts by integrating dynamic mode-shifting rules in Transportation Management Systems that let enterprise clients flip orders between FTL and LTL without re-tendering, deepening account stickiness, and smoothing revenue. LTL's structural tailwinds, parcel surcharge avoidance, omni-channel velocity, and nearshoring-driven lane compression ensure it captures an outsized portion of incremental demand.
Dry Vans held 46.04% of the 2025 freight brokerage services market, but Refrigerated Van is compounding at an 11.15% CAGR as pharma GDP mandates and fresh-food e-commerce require lane-level temperature telemetry. Brokers embed IoT probes that record five-minute temperature intervals and archive digital proof of compliance, reducing claims and securing preferred-shipper status with vaccine producers.
Capitalizing on premium yields, providers are reallocating roughly 7% of dry-van inventory to insulated or hybrid-cooling retrofits, balancing asset risk while pursuing higher-margin cold-chain lanes. The freight brokerage services market for Reefer loads is slated to rise, and equipment specialization strengthens competitive moats because shippers prize partners who master seal integrity, regulatory paperwork, and contingency routing.
Geography Analysis
Asia-Pacific sustains 44.13% revenue share, with the freight brokerage services market size in the region and forecasts to rise with 9.03% CAGR by 2031. ASEAN customs harmonization trims border clearance to 30 minutes, encouraging small Thai and Vietnamese shippers to adopt digital brokerage apps. Indian GST e-way bill automation injects transparency, attracting foreign retailers who demand compliant middle-mile partners.
North America re-orients around nearshoring; US-Mexico surface lanes see cross-border LTL loads jump 18% YoY. Brokers employing bilingual call centers and certified FAST carriers reduce border dwell by 42%, winning Mode Shift awards from automotive OEMs. Canada's CARM rollout compels brokers to embed tariff calculators, lifting compliance service revenue by USD 120 million in 2026 alone.
Europe grapples with ETS Phase 4. Brokers bundling intermodal rail with truck legs cut carbon intensity 42% versus truck-only, earning premium placement on retailer bid boards. eIDAS-driven authentication investment spikes, but early movers enjoy brand lift among pharma shippers who require auditable chain-of-custody logs.
South America and MEA, although sub-10% of global turnover, present frontier upside. Brazilian BR-163 highway paving unlocks soy export corridors, while GCC rail link projects promise multi-modal brokerage opportunities tied to oil-to-chemicals diversification.
- C.H. Robinson Worldwide Inc
- Total Quality Logistics LLC
- RXO Inc.
- Landstar System Inc.
- J.B. Hunt Transport Services Inc.
- Echo Global Logistics Inc.
- Schneider National Inc.
- Hub Group Inc.
- Mode Transportation LLC
- ArcBest Corporation
- Kuehne+Nagel
- Arrive Logistics LLC
- Worldwide Express LLC (WWEX Group)
- DSV A/S
- Sinotrans Limited
- NYK (Yusen Logistics Ltd)
- GEODIS
- Hellmann Worldwide Logistics
- Rohlig Logistics GmbH & Co. KG
- PLS Logistics Services Inc.
Additional Benefits:
- The market estimate (ME) sheet in Excel format
- 3 months of analyst support
TABLE OF CONTENTS
1 Introduction
- 1.1 Study Assumptions and Market Definition
- 1.2 Scope of the Study
2 Research Methodology
3 Executive Summary
4 Market Landscape
- 4.1 Market Overview
- 4.2 Market Drivers
- 4.2.1 Nearshoring and Reshoring Shift Volumes Toward Cross-Border Short-Haul Corridors
- 4.2.2 Omni-Channel Retail Boom Intensifies Middle-Mile Brokerage Demand
- 4.2.3 SME Self-Service Portals Expand Long-Tail Customer Penetration
- 4.2.4 Mega-Mergers Between Brokers and Global 3PLs Unlock One-Stop Capacity Networks
- 4.2.5 Real-Time Cargo-Insurance APIs Create New high-Margin Ancillary Revenue
- 4.2.6 Carbon-Linked Freight Derivatives Attract ESG-Focused Shippers to Broker Platforms
- 4.3 Market Restraints
- 4.3.1 Container-Rate Whiplash Compresses Spot-Margin Windows
- 4.3.2 Inventory Destocking Post-Pandemic Dampens Shipment Volumes 2024-2026
- 4.3.3 Algorithmic Capacity Hoarding by Digital Giants Sidelines Mid-Tier Brokers
- 4.3.4 Stricter Digital-identity & Cybersecurity Mandates (eIDAS 2.0, NIST 800-63) Spike Compliance Spend
- 4.4 Value / Supply-Chain Analysis
- 4.5 Regulatory Landscape
- 4.6 Technological Outlook
- 4.7 Porter's Five Forces
- 4.7.1 Threat of New Entrants
- 4.7.2 Bargaining Power of Suppliers
- 4.7.3 Bargaining Power of Buyers
- 4.7.4 Threat of Substitutes
- 4.7.5 Industry Rivalry
5 Market Size and Growth Forecasts (Value)
- 5.1 By Service
- 5.1.1 Full-Truckload (FTL)
- 5.1.2 Less-than-Truckload (LTL)
- 5.1.3 Others
- 5.2 By Equipment / Trailer Type
- 5.2.1 Dry Van
- 5.2.2 Refrigerated Van
- 5.2.3 Flatbed / Step-Deck
- 5.2.4 Tanker (Bulk Liquid and Chemical)
- 5.2.5 Others
- 5.3 By Haul Length
- 5.3.1 Long-Haul (More than 500 miles)
- 5.3.2 Regional (100-500 miles)
- 5.3.3 Local (Less than 100 miles)
- 5.4 By Business Model
- 5.4.1 Traditional Freight Brokerage
- 5.4.2 Asset-Based Freight Brokerage
- 5.4.3 Agent Model Freight Brokerage
- 5.4.4 Digital Freight Brokerage
- 5.5 By End-User Industry
- 5.5.1 Manufacturing and Automotive
- 5.5.2 Construction and Infrastructure Projects
- 5.5.3 Oil, Gas, Mining and Chemicals
- 5.5.4 Agriculture and Food / Beverage
- 5.5.5 Retail, FMCG and Wholesale Distribution
- 5.5.6 Healthcare and Pharmaceuticals
- 5.5.7 E-commerce and 3PL Fulfilment
- 5.5.8 Other End-User Industry
- 5.6 By Customer Size
- 5.6.1 Large Enterprise Shippers (More than USD 100 M)
- 5.6.2 Mid-Market Shippers (USD 10-100 M)
- 5.6.3 Small Businesses (Less than USD 10 M)
- 5.7 By Geography
- 5.7.1 North America
- 5.7.1.1 United States
- 5.7.1.2 Canada
- 5.7.1.3 Mexico
- 5.7.2 South America
- 5.7.2.1 Brazil
- 5.7.2.2 Peru
- 5.7.2.3 Chile
- 5.7.2.4 Argentina
- 5.7.2.5 Rest of South America
- 5.7.3 Asia-Pacific
- 5.7.3.1 India
- 5.7.3.2 China
- 5.7.3.3 Japan
- 5.7.3.4 Australia
- 5.7.3.5 South Korea
- 5.7.3.6 South East Asia (Singapore, Malaysia, Thailand, Indonesia, Vietnam, and Philippines)
- 5.7.3.7 Rest of Asia-Pacific
- 5.7.4 Europe
- 5.7.4.1 United Kingdom
- 5.7.4.2 Germany
- 5.7.4.3 France
- 5.7.4.4 Spain
- 5.7.4.5 Italy
- 5.7.4.6 BENELUX (Belgium, Netherlands, and Luxembourg)
- 5.7.4.7 NORDICS (Denmark, Finland, Iceland, Norway, and Sweden)
- 5.7.4.8 Rest of Europe
- 5.7.5 Middle East and Africa
- 5.7.5.1 United Arab of Emirates
- 5.7.5.2 Saudi Arabia
- 5.7.5.3 South Africa
- 5.7.5.4 Nigeria
- 5.7.5.5 Rest of Middle East And Africa
- 5.7.1 North America
6 Competitive Landscape
- 6.1 Market Concentration
- 6.2 Strategic Moves
- 6.3 Market Share Analysis
- 6.4 Company Profiles {(includes Global Level Overview, Market Level overview, Core Segments, Financials as available, Strategic Information, Market Rank/Share for key companies, Products and Services, and Recent Developments)}
- 6.4.1 C.H. Robinson Worldwide Inc
- 6.4.2 Total Quality Logistics LLC
- 6.4.3 RXO Inc.
- 6.4.4 Landstar System Inc.
- 6.4.5 J.B. Hunt Transport Services Inc.
- 6.4.6 Echo Global Logistics Inc.
- 6.4.7 Schneider National Inc.
- 6.4.8 Hub Group Inc.
- 6.4.9 Mode Transportation LLC
- 6.4.10 ArcBest Corporation
- 6.4.11 Kuehne+Nagel
- 6.4.12 Arrive Logistics LLC
- 6.4.13 Worldwide Express LLC (WWEX Group)
- 6.4.14 DSV A/S
- 6.4.15 Sinotrans Limited
- 6.4.16 NYK (Yusen Logistics Ltd)
- 6.4.17 GEODIS
- 6.4.18 Hellmann Worldwide Logistics
- 6.4.19 Rohlig Logistics GmbH & Co. KG
- 6.4.20 PLS Logistics Services Inc.
7 Market Opportunities and Future Outlook
- 7.1 White-Space and Unmet-Need Assessment

