
PUBLISHER: Mordor Intelligence | PRODUCT CODE: 2063314

PUBLISHER: Mordor Intelligence | PRODUCT CODE: 2063314
ASEAN Freight Brokerage Services - Market Share Analysis, Industry Trends & Statistics, Growth Forecasts (2026 - 2031)
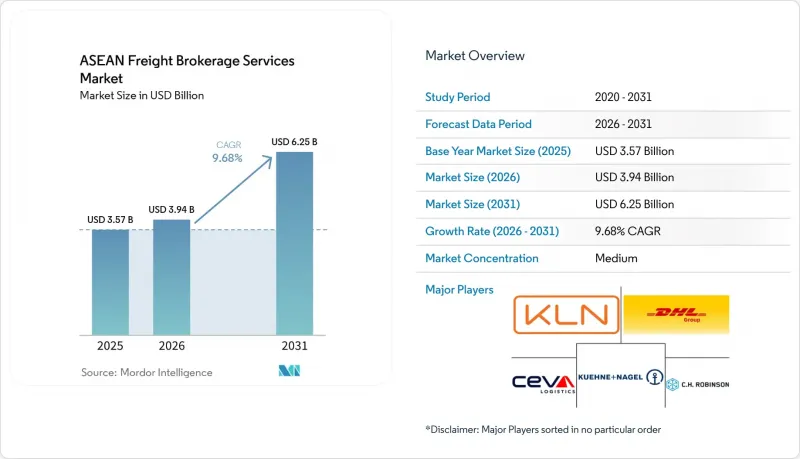
According to Mordor Intelligence, the aSEAN freight brokerage services market size is expected to grow from USD 3.57 billion in 2025 to USD 3.94 billion in 2026 and is forecast to reach USD 6.25 billion by 2031 at a 9.68% CAGR over 2026-2031.
This report is Segmented by Service (FTL, LTL, Others), by Equipment (Dry Van, Refrigerated, Flatbed, Tanker, Others), by Haul Length (Long-Haul, Regional, Local), by Business Model (Traditional, Asset-Based, Agent, Digital), by End-User (Manufacturing, Construction, Agriculture, Retail, and More), by Customer Size (Large, Mid-Market, Small), and Geography. Market Forecasts in Value (USD)
ASEAN Freight Brokerage Services Market Trends and Insights
Nearshoring Surge in LCL Consolidation from "China + 1" Suppliers
Diversified sourcing sends single orders across several ASEAN factories, swelling sub-container loads that require skilled consolidation. Vietnam's electronics exports to the U.S. hit record highs in 2025, with components pooled from plants in Malaysia and Thailand before trans-Pacific sailings. Digital platforms that blend fractional freight across complementary routes cut per-unit shipping costs by up to 35%. Harmonizing tariff codes and rules-of-origin paperwork adds complexity that tech-savvy brokers monetize as a premium service. Equipment shortages still pose a risk, but the volume upside outweighs the cost headwinds in high-growth lanes.
AI-Driven Predictive Tendering & Dynamic Spot-Rate Automation
Machine-learning engines predict carrier availability and ideal tender timing with up to 85% accuracy, letting platforms refresh spot quotes every four hours to reflect lane-level demand shifts and fuel movements. Empty-mile ratios have fallen 12-18% on corridors that adopt these tools, lifting brokerage margins on round trips. Singapore and Malaysia show the highest uptake because cloud infrastructure and carrier EDI integration are mature. Smaller brokers in Myanmar and Cambodia lack the capital and skills to deploy comparable systems, widening the digital divide. Continued investment signals faster consolidation as tech-enabled players undercut legacy brokers.
Chronic Container and Chassis Equipment Imbalance Within ASEAN Hinterlands
Brokers absorb USD 300-550 per move in repositioning fees when boxes pile up in export-heavy zones such as Central Vietnam and outlying Indonesian islands. Empty-mile ratios still hover near 50% on return legs, throttling asset utilization. Refrigerated and out-of-gauge equipment lead-time now stretches to a week in peak months, delaying LCL consolidations. Indonesia's geography compounds the deficit because chassis stranded on smaller islands rarely cycle back efficiently. Without policy interventions or pooling platforms, equipment scarcity will keep trimming margins.
Other drivers and restraints analyzed in the detailed report include:
- ASEAN Customs Single Window Phase II Roll-Out Compressing Dwell Times
- Emergence of Green Freight Corridors & ESG-Linked Shipping Finance
- Enduring Port Congestion at Secondary Gateways and Inland Connectivity Gaps
For complete list of drivers and restraints, kindly check the Table Of Contents.
Segment Analysis
Full-truckload (FTL) transport held 61.00% of the overall 2025 revenue, reflecting its grip on bulk manufacturing lanes. Yet, less-than-truckload (LTL) is advancing at a 12.20% CAGR because China + 1 strategies splinter orders across multiple ASEAN plants. Digital consolidators now sweep partial pallets from Vietnam, Malaysia, and Thailand into single containers for U.S. sailings, shrinking landed costs by up to 35%. Predictive cube-planning and automated documentation prevent the margin erosion that once plagued LCL brokerage. FTL remains indispensable for heavy industry, but its share edges lower as just-in-time inventory models favor frequent, smaller moves.
Growth potential also lies in specialized add-ons. Temperature-controlled LTL lanes bundle GDP-compliant handling with blockchain lot tracking for vaccines, commanding premium rates. Same-day cross-border micro-LTL projects between Johor and Singapore target e-commerce replenishment cycles that cannot wait for full loads. Brokers equipped with dynamic routing engines stitch these opportunities into scheduled networks that run at 85-90% utilization even in off-peak weeks. The result is a resilient revenue mix less exposed to cyclical bulk-cargo swings.
Dry vans dominated at 48.94% share in 2025, but refrigerated vans registered a brisk 13.52% CAGR through 2031 as vaccine distribution and fresh-food exports multiply. Pharma clusters in Bangkok and Ho Chi Minh City now specify end-to-end temperature logs in tenders, obliging brokers to prove sensor integrity and driver compliance. IoT-enabled reefers transmit real-time alerts that cut spoilage claims below 0.5%, winning repeat orders from global drug makers. Dry-van demand endures for electronics and textiles, yet margins compress when spot capacity swings flood the market with extra trucks.
Flatbed and step-deck trailers ride infrastructure spending on highways and wind-farm components, while tankers support regional chemical flows. Still, the real battleground is data visibility. Brokers embedding lane-level temperature variance into rate formulas justify premiums over commodity forwarders who merely procure capacity. As investors chase ESG-aligned assets, fleets with electric refrigeration units and solar-powered monitoring draw lower financing costs, reinforcing the growth loop in cold-chain brokerage.
List of Companies Covered in this Report:
- DHL Group
- Kuehne + Nagel
- Kerry Logistics Network
- CEVA Logistics
- C.H. Robinson
- Nippon Express
- DSV
- Yusen Logistics
- Expeditors International
- Transporeon
- CJ Logistics
- Forto
- Tiong Nam Logistics
- Linc Group
- Geodis
- Rhenus Logistics
- Hellmann Worldwide Logistics
- APX Logistics Solutions Co., Ltd
- Haulio
- Logisly
Additional Benefits:
- The market estimate (ME) sheet in Excel format
- 3 months of analyst support
TABLE OF CONTENTS
1 Introduction
- 1.1 Study Assumptions and Market Definition
- 1.2 Scope of the Study
2 Research Methodology
3 Executive Summary
4 Market Landscape
- 4.1 Market Overview
- 4.2 Market Drivers
- 4.2.1 AI-Driven Predictive Tendering and Dynamic Spot-Rate Automation
- 4.2.2 ASEAN Customs Single Window Phase II Roll-Out Compressing Dwell Times
- 4.2.3 Emergence of Green Freight Corridors and ESG-Linked Shipping Finance
- 4.2.4 Nearshoring-Driven Surge in LCL Consolidation from "China + 1" Suppliers
- 4.2.5 Expansion of Regional Cold-Chain Pharma Hubs Boosting Temperature-Controlled Brokerage
- 4.2.6 Shift of Marine Insurance Premia Toward Alternate Sea Trans-Shipment Hubs
- 4.3 Market Restraints
- 4.3.1 Chronic Container and Chassis Equipment Imbalance within ASEAN Hinterlands
- 4.3.2 Regulatory Ambiguity on Digital-Broker Licensing and Data-Localization Mandates
- 4.3.3 Enduring Port Congestion at Secondary Gateways and Inland Connectivity Gaps
- 4.3.4 Currency-Volatility-Driven Hedging Costs Compressing Brokerage Margins
- 4.4 Value / Supply-Chain Analysis
- 4.5 Regulatory Landscape
- 4.6 Technological Outlook
- 4.7 Porter's Five Forces
- 4.7.1 Threat of New Entrants
- 4.7.2 Bargaining Power of Suppliers
- 4.7.3 Bargaining Power of Buyers
- 4.7.4 Threat of Substitutes
- 4.7.5 Competitive Rivalry
5 Market Size and Growth Forecasts (Value)
- 5.1 By Service
- 5.1.1 Full-Truckload (FTL)
- 5.1.2 Less-than-Truckload (LTL)
- 5.1.3 Others
- 5.2 By Equipment / Trailer Type
- 5.2.1 Dry Van
- 5.2.2 Refrigerated Van
- 5.2.3 Flatbed / Step-Deck
- 5.2.4 Tanker (Bulk Liquid and Chemical)
- 5.2.5 Others
- 5.3 By Haul Length
- 5.3.1 Long-Haul (More than 500 miles)
- 5.3.2 Regional (100-500 miles)
- 5.3.3 Local (Less than 100 miles)
- 5.4 By Business Model
- 5.4.1 Traditional Freight Brokerage
- 5.4.2 Asset-Based Freight Brokerage
- 5.4.3 Agent Model Freight Brokerage
- 5.4.4 Digital Freight Brokerage
- 5.5 By End-User Industry
- 5.5.1 Manufacturing and Automotive
- 5.5.2 Construction and Infrastructure Projects
- 5.5.3 Oil, Gas, Mining and Chemicals
- 5.5.4 Agriculture and Food / Beverage
- 5.5.5 Retail, FMCG and Wholesale Distribution
- 5.5.6 Healthcare and Pharmaceuticals
- 5.5.7 E-commerce and 3PL Fulfilment
- 5.5.8 Other End-User Industry
- 5.6 By Customer Size
- 5.6.1 Large Enterprise Shippers (More than USD 100 M)
- 5.6.2 Mid-Market Shippers (USD 10-100 M)
- 5.6.3 Small Businesses (Less than USD 10 M)
- 5.7 By Country
- 5.7.1 Indonesia
- 5.7.2 Vietnam
- 5.7.3 Thailand
- 5.7.4 Malaysia
- 5.7.5 Philippines
- 5.7.6 Singapore
- 5.7.7 Myanmar
- 5.7.8 Cambodia
- 5.7.9 Laos
- 5.7.10 Brunei
6 Competitive Landscape
- 6.1 Market Concentration
- 6.2 Strategic Moves and Developments
- 6.3 Market Share Analysis
- 6.4 Company Profiles (includes Global level Overview, Market level overview, Core Segments, Financials as available, Strategic Information, Market Rank/Share for key companies, Products and Services, and Recent Developments)
- 6.4.1 DHL Group
- 6.4.2 Kuehne + Nagel
- 6.4.3 Kerry Logistics Network
- 6.4.4 CEVA Logistics
- 6.4.5 C.H. Robinson
- 6.4.6 Nippon Express
- 6.4.7 DSV
- 6.4.8 Yusen Logistics
- 6.4.9 Expeditors International
- 6.4.10 Transporeon
- 6.4.11 CJ Logistics
- 6.4.12 Forto
- 6.4.13 Tiong Nam Logistics
- 6.4.14 Linc Group
- 6.4.15 Geodis
- 6.4.16 Rhenus Logistics
- 6.4.17 Hellmann Worldwide Logistics
- 6.4.18 APX Logistics Solutions Co., Ltd
- 6.4.19 Haulio
- 6.4.20 Logisly
7 Market Opportunities and Future Outlook
- 7.1 White-space and Unmet-Need Assessment

