PUBLISHER: Mordor Intelligence | PRODUCT CODE: 2187649

PUBLISHER: Mordor Intelligence | PRODUCT CODE: 2187649
India E-commerce - Market Share Analysis, Industry Trends & Statistics, Growth Forecasts (2027 - 2032)
According to Mordor Intelligence, the India e-commerce market size is expected to increase from USD 159.3 billion in 2026 to USD 184.6 billion in 2027 and reach USD 378 billion by 2032, growing at a CAGR of 15.42% over 2027-2032.
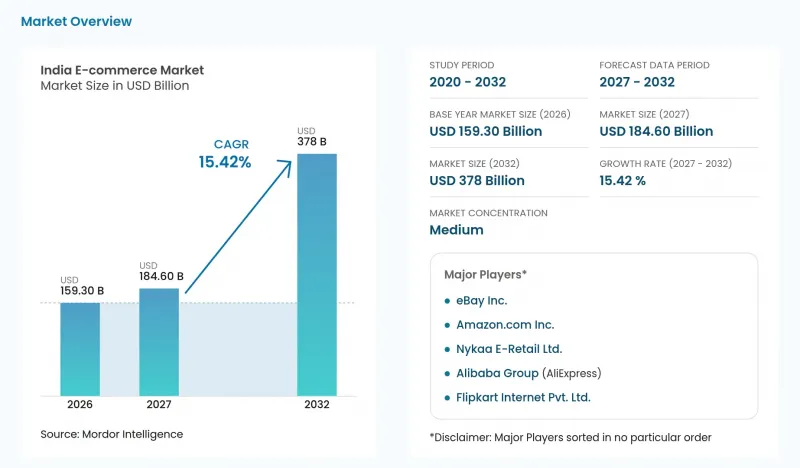
This report is segmented by Business Model (B2C and B2B), Device Type (Smartphone / Mobile, Desktop and Laptop, and more), Payment Method (Digital Wallets and UPI, Credit and Debit Cards, and more), and Product Category (Fashion and Apparel, Consumer Electronics, and more). The market forecasts are provided in terms of value (USD), based on availability.
India E-commerce Market Trends and Insights
Rising UPI and Instant Payment Adoption in Tier II-III Cities
Instant payments can support online demand by separating the ability to pay from the location where merchandise changes hands. UPI's operator, NPCI, reported that UPI processed 241.6 billion transactions in India in FY2025-26, up 30% from the prior year. Rukam Capital's survey found that 67% of surveyed Tier 2 and Tier 3 consumers used UPI platforms as their primary payment mode. For sellers entering smaller cities and towns, accepting UPI connects online ordering with that established payment habit. Where customers pay before dispatch, the payment can be confirmed before the parcel enters the delivery network. Sellers can therefore take a prepaid first order from a new town through a familiar payment route before committing delivery resources.
Low-Cost Data Plans Driving Video-Led Buying Journeys
Data affordability creates room for video to explain products before a shopper commits to an online purchase. The Telecom Regulatory Authority of India reported that average revenue realization per GB for wireless data use fell 5.07% between the quarters ending March and June 2026. Google reported that shopping-related YouTube watch time in India grew more than 55% year over year in April 2026. For merchants, these parallel indicators point to a larger opportunity for visual product evaluation before checkout. In Google's September to November 2025 Ipsos survey, 61% of 426 Indian Navratri and Diwali shoppers who bought within 2 days without product research used YouTube Shorts during their shopping journey, averaged across 7 categories. Short video therefore sits inside fast purchase decisions, so cheaper data lowers the viewing cost of the clips that shoppers already use before they buy.
Inconsistent Interstate Logistics and Reverse-Logistics Costs
Fulfillment costs can make additional online demand commercially unattractive when delivery consumes too much of an order's value. Meesho's 2025 prospectus described some fashion, grocery and home-goods use cases as otherwise unviable because of high fulfillment costs. It also warned that higher seller logistics costs could reduce shopping frequency on its platform if sellers passed them to consumers. That creates a choice between absorbing delivery costs and risking weaker demand through higher prices. The prospectus described seller incentives for prepaid orders to reduce cancellation and refusal risks, which can increase logistics costs. The remaining constraint is the basic cost of moving a low-ticket item, even when payment succeeds.
Other drivers and restraints analyzed in the detailed report include:
- Direct-to-Consumer Brand Boom Fueled by Domestic VC Funding
- Quick-Commerce Penetration in Top-20 Cities Drives the Market
- Compliance Burden from Consumer Protection (E-Commerce) Rules, 2020
For complete list of drivers and restraints, kindly check the Table Of Contents.
Segment Analysis
B2C accounted for an 86.22% share of the India e-commerce market size in 2026, making it the largest segment. Bain and Flipkart estimated that India's e-retail shopper base doubled over 5 years to 290 to 300 million in 2025. A wider assortment adds buying occasions only when the seller can carry each offer through to a completed order. For consumer platforms, this enlarged online shopper base makes serving additional purchase occasions a distinct expansion route alongside recruiting first-time users.
B2B is forecast to grow at a CAGR of 16.4% over 2027-2032, making it the fastest-growing segment. IndiaMART recorded 26 million unique business inquiries in India in the quarter ended June 30, 2026. Separately, Amazon Business bulk orders grew 120% year over year during India's 2025 Great Indian Festival. The 2 models serve different points in a business purchase, with supplier discovery opening a relationship and bulk ordering turning a defined requirement into an online order. Inquiry-led platforms can add order execution, while bulk-order services can pursue repeat procurement from buyers with defined business requirements.
Smartphone / mobile accounted for 76.6% of B2C transaction value in 2026, making it the largest segment by device. A January-March 2025 telecom survey estimated that approximately 85.5% of Indian households possessed at least one smartphone. That household reach gives mobile-first storefronts a broad potential access base for product discovery and online payment. With smartphones widely held, retailers can direct mobile investment toward browsing and order completion on the customer's existing screen.
Other device types form the fastest-growing segment, with a forecast CAGR of 17.8% over 2027-2032. Amazon launched Alexa+ in India through an Early Access program on September 16, 2026, with shopping functions available through Echo and Fire TV devices as well as its app. Alexa+ suggests a preferred brand, seeks confirmation before ordering and offers alternatives when an item is unavailable. These functions give voice-driven reordering on smart speakers and connected televisions a concrete link to item selection and purchase approval. For retailers, integration must preserve that confirmation step so conversational suggestions become an authorized order.
Complete Report Scope:
- By Business Model
- B2C
- B2B
- By Device Type (B2C)
- Smartphone / Mobile
- Desktop and Laptop
- Other Device Types
- By Payment Method (B2C)
- Credit and Debit Cards
- Digital Wallets and UPI
- BNPL
- Other Payment Methods
- By Product Category (B2C)
- Beauty and Personal Care
- Consumer Electronics
- Fashion and Apparel
- Food and Beverages
- Furniture and Home
- Toys, DIY and Media
- Other Product Categories
List of Companies Covered in this Report:
- Amazon.com Inc.
- Flipkart Internet Pvt. Ltd.
- Reliance Retail Ltd.
- Meesho
- Nykaa E-Retail Ltd.
- Tata CLiQ
- Myntra Designs Pvt. Ltd.
- BigBasket (Innovative Retail Concepts Pvt. Ltd.)
- Blinkit (Blink Commerce Pvt. Ltd.)
- Paytm Mall
- Pepperfry Ltd.
- Lenskart Solutions Ltd.
- FirstCry (BrainBees Solutions)
- IndiaMART InterMESH Ltd.
- Snapdeal Pvt. Ltd.
- Purplle.com
- Zivame (Actoserba Active Wholesale)
- ShopClues (Clues Network)
- eBay Inc.
- Alibaba Group (AliExpress)
- Apple Inc.
Additional Benefits:
- The market estimate (ME) sheet in Excel format
- 3 months of analyst support
TABLE OF CONTENTS
1 INTRODUCTION
- 1.1 Study Assumptions and Market Definition
- 1.2 Scope of the Study
2 RESEARCH METHODOLOGY
3 EXECUTIVE SUMMARY
4 MARKET LANDSCAPE
- 4.1 Market Overview
- 4.2 Market Drivers
- 4.2.1 Rising UPI and Instant Payment Adoption in Tier II-III Cities
- 4.2.2 Low-Cost Data Plans Driving Video-Led Buying Journeys
- 4.2.3 Direct-to-Consumer Brand Boom Fueled by Domestic VC Funding
- 4.2.4 Quick-Commerce Penetration in Top-20 Cities Drives the Market
- 4.2.5 Social-Commerce Influencer Ecosystem Monetization
- 4.2.6 Government ONDC Framework Expands Seller Reach (Under-the-Radar)
- 4.3 Market Restraints
- 4.3.1 Inconsistent Interstate Logistics and Reverse-Logistics Costs
- 4.3.2 Compliance Burden from Consumer Protection (E-Commerce) Rules, 2020
- 4.3.3 High Customer Acquisition Cost Outside Metros
- 4.3.4 Data-Privacy Concerns Limiting Hyper-Personalization
- 4.3.5 Rising Digital Ad Fraud Inflating Marketing Budgets (Under-the-Radar)
- 4.4 Industry Value Chain Analysis
- 4.5 Regulatory Landscape
- 4.6 Technological Outlook
- 4.7 Porter's Five Forces Analysis
- 4.7.1 Threat of New Entrants
- 4.7.2 Bargaining Power of Suppliers
- 4.7.3 Bargaining Power of Buyers
- 4.7.4 Threat of Substitutes
- 4.7.5 Competitive Rivalry
- 4.8 Impact of Macroeconomic Factors on the Market
- 4.9 Key Market Trends and Share of E-Commerce in Total Retail
- 4.10 Analysis of Key Demographic Trends and Patterns
- 4.11 Analysis of Key Modes of Transaction
- 4.12 Cross-Border E-Commerce Outlook
- 4.13 Current Positioning of India within Asia-Pacific E-Commerce
5 MARKET SIZE AND GROWTH FORECASTS (VALUE)
- 5.1 By Business Model
- 5.1.1 B2C
- 5.1.2 B2B
- 5.2 By Device Type (B2C)
- 5.2.1 Smartphone / Mobile
- 5.2.2 Desktop and Laptop
- 5.2.3 Other Device Types
- 5.3 By Payment Method (B2C)
- 5.3.1 Credit and Debit Cards
- 5.3.2 Digital Wallets and UPI
- 5.3.3 BNPL
- 5.3.4 Other Payment Methods
- 5.4 By Product Category (B2C)
- 5.4.1 Beauty and Personal Care
- 5.4.2 Consumer Electronics
- 5.4.3 Fashion and Apparel
- 5.4.4 Food and Beverages
- 5.4.5 Furniture and Home
- 5.4.6 Toys, DIY and Media
- 5.4.7 Other Product Categories
6 COMPETITIVE LANDSCAPE
- 6.1 Market Concentration
- 6.2 Strategic Moves
- 6.3 Market Share Analysis
- 6.4 Company Profiles (includes Global level Overview, Market level overview, Core Segments, Financials as available, Strategic Information, Market Rank/Share for key companies, Products and Services, and Recent Developments)
- 6.4.1 Amazon.com Inc.
- 6.4.2 Flipkart Internet Pvt. Ltd.
- 6.4.3 Reliance Retail Ltd.
- 6.4.4 Meesho
- 6.4.5 Nykaa E-Retail Ltd.
- 6.4.6 Tata CLiQ
- 6.4.7 Myntra Designs Pvt. Ltd.
- 6.4.8 BigBasket (Innovative Retail Concepts Pvt. Ltd.)
- 6.4.9 Blinkit (Blink Commerce Pvt. Ltd.)
- 6.4.10 Paytm Mall
- 6.4.11 Pepperfry Ltd.
- 6.4.12 Lenskart Solutions Ltd.
- 6.4.13 FirstCry (BrainBees Solutions)
- 6.4.14 IndiaMART InterMESH Ltd.
- 6.4.15 Snapdeal Pvt. Ltd.
- 6.4.16 Purplle.com
- 6.4.17 Zivame (Actoserba Active Wholesale)
- 6.4.18 ShopClues (Clues Network)
- 6.4.19 eBay Inc.
- 6.4.20 Alibaba Group (AliExpress)
- 6.4.21 Apple Inc.
7 MARKET OPPORTUNITIES AND FUTURE OUTLOOK
- 7.1 White-Space and Unmet-Need Assessment

