PUBLISHER: Mordor Intelligence | PRODUCT CODE: 2187664

PUBLISHER: Mordor Intelligence | PRODUCT CODE: 2187664
B2B E-commerce - Market Share Analysis, Industry Trends & Statistics, Growth Forecasts (2027 - 2032)
According to Mordor Intelligence, the B2B e-commerce market size is expected to grow from USD 36.86 trillion in 2026 to USD 40.86 trillion in 2027 and is forecast to reach USD 67.56 trillion by 2032 at 10.58% CAGR over 2027-2032.
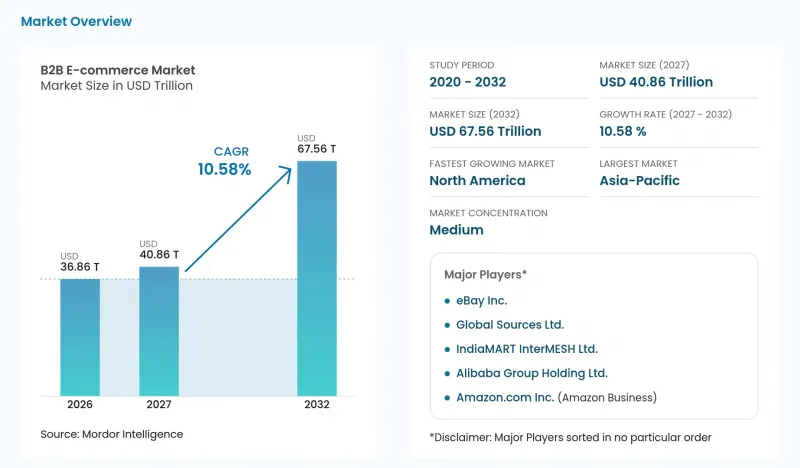
This report is segmented by Channel (Marketplace Sales and Direct Sales), Transaction Model (Domestic and Cross-Border), Payment Method (Bank Transfers and ACH, Credit and Debit Cards, and more), Industry Vertical (Manufacturing, Retail and Wholesale, and more), and Geography (Asia-Pacific, North America, and more). The market forecasts are provided in terms of value (USD), based on availability.
Global B2B E-commerce Market Trends and Insights
Rise of AI-Powered Procurement Platforms Accelerating Self-Service Buying
For a business buyer, the value of AI guidance depends on whether it resolves a question that would otherwise interrupt purchasing. Achilles' 2026 survey of 2,805 organizations across Australia, Europe, the Middle East, and the Americas found 10.9% reporting operational AI use in some procurement or supplier-risk processes. Amazon Business launched its AI assistant in the United States by November 2025 to provide conversational purchasing and account guidance. The assistant is available to U.S. customers on desktop on selected settings pages. Operational AI use describes a minority of the surveyed organizations, while Amazon Business provides a specific platform-led self-service application. Buyers and administrators can resolve purchasing and account questions inside the platform, making access to existing features part of the self-service proposition.
Manufacturing SMEs in Asia Digitizing Cross-Border Sourcing via Marketplaces
Alibaba.com connects Chinese and overseas suppliers with overseas wholesale buyers, typically including manufacturers and SMEs engaged in import and export, through sourcing and online transaction services. Asian manufacturing SMEs gain from cross-border marketplaces when a wider supplier search leads to an input their production process can actually use. An attractive online price cannot compensate for a specification mismatch that makes the purchased input unusable. The relevant demand mechanism is therefore qualification within the transaction, with technical requirements carried from the initial request into an offer the buyer can accept. For a small manufacturer, that design can make an overseas option comparable with a domestic offer on the requirement that matters to the factory. Moving that comparison into the marketplace gives the channel a role in selecting production inputs, expanding its use beyond locating potential suppliers.
Escalating Marketplace Compliance Costs for Hazardous Goods Sellers
For hazardous-goods sellers, shipping obligations and fulfillment fees constrain the contribution available from additional online orders. Under 49 CFR § 173.22, a person offering hazardous material in packaging required by Part 173 must classify and describe it and determine that packaging is authorized, except as otherwise provided in that part. Walmart Marketplace sellers using Walmart Fulfillment Services in the United States pay an additional USD 0.5 per standard item that is or contains a chemical, aerosol, pesticide, or battery. Because the charge attaches to eligible items, increasing their order count also increases the associated fee burden. The addition represents a larger fraction of the selling price for a low-value item than for an expensive one. Product mix consequently affects the contribution left after handling charges to support shipment-compliance work.
Other drivers and restraints analyzed in the detailed report include:
- Virtual Cards and BNPL Penetration Simplifying High-Value B2B Checkout in Europe
- Transition from EDI to API-First Integration Unlocking Real-Time Pricing Visibility
- Rising Cross-Border Data Residency Restrictions
For complete list of drivers and restraints, kindly check the Table Of Contents.
Segment Analysis
Marketplace sales accounted for a 67.02% share of the B2B e-commerce market size in 2026, with a 13.62% CAGR forecast over 2027-2032. Amazon Business served over 11 million organizations worldwide in July 2026. For the largest segment and the fastest-growing segment, this organizational reach makes shared marketplace access commercially relevant to suppliers. Worldwide reach makes geographic fit relevant when a supplier chooses which national business audiences its product offer can serve. A supplier can use such a buying destination to reach an established business audience while concentrating its own resources on the products and terms offered within that channel.
Marketplace growth can also come from a wider range of purchases becoming possible for buyers already using the channel. Amazon Business said its worldwide product selection grew nearly 30% in 2026 compared with 2025. Selection growth in repair tools, office furniture, and fresh groceries illustrates how the channel can address different business purchasing needs. Direct sales offer another connection, with Grainger's High-Touch Solutions N.A. customers using eProcurement platforms that communicated directly with its systems in 2025. The supplier's choice is therefore between access through an aggregated buying venue and investment in a direct electronic relationship with its customer.
Domestic transactions led with 56.39% of market value in 2026 and are forecast to grow at 11.97% CAGR over 2027-2032, ranking as the largest segment and the fastest-growing segment. For suppliers already serving business customers in their own country, growth can come from moving more of those relationships' orders online. A webstore or direct procurement portal can be designed around the agreed account terms and products in that relationship. The commercial test is whether the online channel can handle a purchase that would otherwise require a separate interaction with the supplier. Digital penetration can expand the measured domestic segment without requiring the underlying business relationship to become international.
Cross-border sourcing offers a separate path to digital demand through buyers moving beyond offline purchasing. In a March and April 2026 survey of Hong Kong cross-border sourcing professionals and traders, nearly 80% expected online sourcing to increase over the next 12 months. Half of those sourcing exclusively offline also expected an increase. For a supplier reaching those buyers, the relevant design problem is making the first online sourcing decision usable, from the offered product to the terms on which an order can proceed. That differs from adding traffic to an established domestic account channel, since the opportunity involves converting an offline sourcing relationship into a digital purchase path.
Complete Report Scope:
- By Channel
- Direct Sales
- Marketplace Sales
- By Transaction Model
- Domestic
- Cross-Border
- By Payment Method
- Bank Transfers and ACH
- Credit and Debit Cards
- Other Payment Methods
- By Industry Vertical
- Manufacturing
- Retail and Wholesale
- Healthcare and Life Sciences
- Automotive
- Construction and Building Materials
- Other Industry Verticals
- By Geography
- North America
- United States
- Canada
- Mexico
- Europe
- Germany
- United Kingdom
- France
- Italy
- Spain
- Rest of Europe
- Asia-Pacific
- China
- Japan
- South Korea
- India
- Southeast Asia (Singapore, Indonesia, Thailand, Vietnam, Philippines)
- Rest of Asia-Pacific
- South America
- Brazil
- Argentina
- Chile
- Rest of South America
- Middle East
- United Arab Emirates
- Saudi Arabia
- Turkey
- Rest of Middle East
- Africa
- South Africa
- Nigeria
- Kenya
- Rest of Africa
- North America
Geography Analysis
Asia-Pacific accounted for 69.1% of the B2B e-commerce market size in 2026, making it the largest regional market. China recorded CNY 46.73 trillion (USD 6.54 trillion) in 2025 goods and services e-commerce transactions with businesses and individuals through enterprise-built and third-party platforms. Those two platform types give suppliers different routes into digital commerce, combining their own transaction systems with access through an external venue. B2B expansion can therefore center on adapting existing transaction channels to organizational purchase requirements, giving suppliers a route to deeper business use of China's broad digital-commerce base.
North America is the fastest-growing regional market, with a forecast CAGR of 11.85% over 2027-2032. W.W. Grainger Inc. reported 11.9% year-over-year sales growth in its High-Touch Solutions N.A. segment in Q2 2026, driven by volume growth and price inflation as tariff costs were passed through. The combination of physical demand and repricing gives distributors a reason to connect additional purchasing activity with clear communication of changing commercial terms. For a digital ordering channel serving that setting, carrying more orders is only part of the opportunity, because making supplier price changes usable within the buying workflow can also determine its value to customers.
In Europe, an April 20-29, 2025, Polish survey of 877 micro, small, and medium-sized firm representatives found 81% using marketplaces, indicating an established purchasing channel among respondents. MercadoLibre Inc.'s 2025 Mercado Libre Negocios launch included Brazil, Argentina, and Chile in South America, offering business buyers wholesale prices, business-hour deliveries, and procurement-team configurations. In the Middle East, Dubai's Department of Economy and Tourism and Dubai Chambers agreed with Tradeling on January 26, 2026, to help Dubai SMEs digitize wholesale operations. Mawu Africa connects East and Southern African artisans with global buyers and offers bulk hospitality and corporate-gifting sourcing, giving those business buyers a specialized channel. In Oman, Ooredoo partnered with Bawwaba in 2025 to launch a B2B marketplace for service promotion and partner discovery, making online supplier visibility the immediate commercial entry point.
- Alibaba Group Holding Ltd.
- Amazon.com Inc. (Amazon Business)
- IndiaMART InterMESH Ltd.
- eBay Inc.
- Global Sources Ltd.
- W.W. Grainger Inc. (Zoro)
- Walmart Inc. (Walmart Business)
- Shopify Inc.
- Unite Procurement Deutschland AG
- DHgate.com
- Rakuten Group Inc.
- Flipkart Pvt. Ltd.
- Made-in-China.com (Focus Technology)
- Ozon IPJSC
- MercadoLibre Inc.
- Commerce.com Inc. (B2B Edition)
- Quill LLC (Staples)
- eWorldTrade.com
- Thomas Publishing Company (Thomasnet)
- Xometry Inc.
Additional Benefits:
- The market estimate (ME) sheet in Excel format
- 3 months of analyst support
TABLE OF CONTENTS
1 INTRODUCTION
- 1.1 Study Assumptions and Market Definition
- 1.2 Scope of the Study
2 RESEARCH METHODOLOGY
3 EXECUTIVE SUMMARY
4 MARKET LANDSCAPE
- 4.1 Market Overview
- 4.2 Market Drivers
- 4.2.1 Rise of AI-Powered Procurement Platforms Accelerating Self-Service Buying
- 4.2.2 Manufacturing SMEs in Asia Digitizing Cross-Border Sourcing via Marketplaces
- 4.2.3 Virtual Cards and BNPL Penetration Simplifying High-Value B2B Checkout in Europe
- 4.2.4 Transition from EDI to API-First Integration Unlocking Real-Time Pricing Visibility
- 4.2.5 Sustainability-Driven Supplier Selection Boosting Verified Low-Carbon Marketplaces
- 4.2.6 Generative AI-Enabled Quote Automation Reducing Sales-Cycle Times for Industrial Distributors
- 4.3 Market Restraints
- 4.3.1 Escalating Marketplace Compliance Costs for Hazardous Goods Sellers
- 4.3.2 Rising Cross-Border Data Residency Restrictions
- 4.3.3 Surge in B2B Payment Fraud and Chargeback Risk for High-Ticket Orders
- 4.3.4 Limited SKU Data Standardization Hindering Predictive Replenishment Algorithms
- 4.4 Industry Value Chain Analysis
- 4.5 Regulatory Landscape
- 4.6 Technological Outlook
- 4.7 Porter's Five Forces Analysis
- 4.7.1 Threat of New Entrants
- 4.7.2 Bargaining Power of Suppliers
- 4.7.3 Bargaining Power of Buyers
- 4.7.4 Threat of Substitutes
- 4.7.5 Competitive Rivalry
- 4.8 Impact of Macroeconomic Factors on the Market
- 4.9 Analysis on Prevalent Modes of Payments in B2B E-Commerce
- 4.10 Analysis of Customer Acquisition Trends
- 4.11 Analysis of Major Case Studies
- 4.12 Analysis of B2B E-Commerce Share in Total E-Commerce (Key Countries)
5 MARKET SIZE AND GROWTH FORECASTS (VALUE)
- 5.1 By Channel
- 5.1.1 Direct Sales
- 5.1.2 Marketplace Sales
- 5.2 By Transaction Model
- 5.2.1 Domestic
- 5.2.2 Cross-Border
- 5.3 By Payment Method
- 5.3.1 Bank Transfers and ACH
- 5.3.2 Credit and Debit Cards
- 5.3.3 Other Payment Methods
- 5.4 By Industry Vertical
- 5.4.1 Manufacturing
- 5.4.2 Retail and Wholesale
- 5.4.3 Healthcare and Life Sciences
- 5.4.4 Automotive
- 5.4.5 Construction and Building Materials
- 5.4.6 Other Industry Verticals
- 5.5 By Geography
- 5.5.1 North America
- 5.5.1.1 United States
- 5.5.1.2 Canada
- 5.5.1.3 Mexico
- 5.5.2 Europe
- 5.5.2.1 Germany
- 5.5.2.2 United Kingdom
- 5.5.2.3 France
- 5.5.2.4 Italy
- 5.5.2.5 Spain
- 5.5.2.6 Rest of Europe
- 5.5.3 Asia-Pacific
- 5.5.3.1 China
- 5.5.3.2 Japan
- 5.5.3.3 South Korea
- 5.5.3.4 India
- 5.5.3.5 Southeast Asia (Singapore, Indonesia, Thailand, Vietnam, Philippines)
- 5.5.3.6 Rest of Asia-Pacific
- 5.5.4 South America
- 5.5.4.1 Brazil
- 5.5.4.2 Argentina
- 5.5.4.3 Chile
- 5.5.4.4 Rest of South America
- 5.5.5 Middle East
- 5.5.5.1 United Arab Emirates
- 5.5.5.2 Saudi Arabia
- 5.5.5.3 Turkey
- 5.5.5.4 Rest of Middle East
- 5.5.6 Africa
- 5.5.6.1 South Africa
- 5.5.6.2 Nigeria
- 5.5.6.3 Kenya
- 5.5.6.4 Rest of Africa
- 5.5.1 North America
6 COMPETITIVE LANDSCAPE
- 6.1 Market Concentration
- 6.2 Strategic Moves
- 6.3 Market Share Analysis
- 6.4 Company Profiles (includes Global level Overview, Market level overview, Core Segments, Financials as available, Strategic Information, Market Rank/Share for key companies, Products and Services, and Recent Developments)
- 6.4.1 Alibaba Group Holding Ltd.
- 6.4.2 Amazon.com Inc. (Amazon Business)
- 6.4.3 IndiaMART InterMESH Ltd.
- 6.4.4 eBay Inc.
- 6.4.5 Global Sources Ltd.
- 6.4.6 W.W. Grainger Inc. (Zoro)
- 6.4.7 Walmart Inc. (Walmart Business)
- 6.4.8 Shopify Inc.
- 6.4.9 Unite Procurement Deutschland AG
- 6.4.10 DHgate.com
- 6.4.11 Rakuten Group Inc.
- 6.4.12 Flipkart Pvt. Ltd.
- 6.4.13 Made-in-China.com (Focus Technology)
- 6.4.14 Ozon IPJSC
- 6.4.15 MercadoLibre Inc.
- 6.4.16 Commerce.com Inc. (B2B Edition)
- 6.4.17 Quill LLC (Staples)
- 6.4.18 eWorldTrade.com
- 6.4.19 Thomas Publishing Company (Thomasnet)
- 6.4.20 Xometry Inc.
7 MARKET OPPORTUNITIES AND FUTURE OUTLOOK
- 7.1 White-Space and Unmet-Need Assessment

