PUBLISHER: Mordor Intelligence | PRODUCT CODE: 2187694

PUBLISHER: Mordor Intelligence | PRODUCT CODE: 2187694
United States Vans - Market Share Analysis, Industry Trends & Statistics, Growth Forecasts (2026 - 2031)
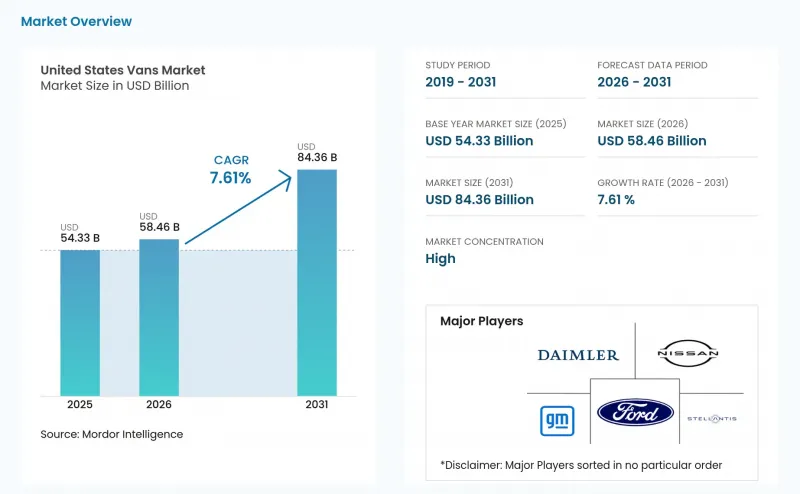
According to Mordor Intelligence, the United States vans market size was valued at USD 54.33 billion in 2025 and is estimated to grow from USD 58.46 billion in 2026 to reach USD 84.36 billion by 2031, at a CAGR of 7.61% during the forecast period (2026-2031).
United States Vans Market Trends and Insights
Accelerating Parcel E Commerce Driving Urban Last Mile Van Demand
E-commerce fulfillment networks continue to raise daily parcel volumes, concentrating deliveries in major metropolitan areas. National parcel carriers now deploy large electric-van fleets to cut operating expenses on stop-and-go routes. Urban idling restrictions further push fleet managers toward zero-emission models that avoid ticketing and access limitations. Competitive pressure for same-day delivery solidifies demand for quick-charge battery systems that keep vans in continuous rotation. The confluence of fuel savings, regulatory compliance, and customer service expectations shortens the payback window for urban electric vans.
Federal and State Zero Emission Mandates for Commercial Vehicles
The Environmental Protection Agency issued progressively stricter medium-duty greenhouse gas limits that take effect in model year 2027. Parallel state regulations, led by the California Air Resources Board, require high-priority fleets to shift new purchases entirely to zero-emission models on a staged timeline. More than a dozen additional states have adopted similar rules, collectively covering roughly 40% of the commercial-vehicle market. Automakers are therefore engineering nationwide compliance solutions rather than region-specific variants. The harmonized push accelerates technology rollouts and broadens electric-van availability even in voluntary-adoption states.
High Up Front Price Premium of Electric Vans Versus ICE Vans
Purchase premiums of roughly one-third above comparable gasoline models continue to deter cost-sensitive buyers. Federal credits offset part of the gap, but eligibility hinges on domestic content rules that exclude some imported chassis. Small businesses often lack the capital or credit lines required for higher sticker prices. Lease programs and battery-as-a-service offerings have emerged, yet remain concentrated among large fleets. Until pack costs fall further, sticker shock will moderate adoption outside urban parcels and corporate fleets.
Other drivers and restraints analyzed in the detailed report include:
- Declining LFP Battery Costs Enabling Larger Van Packs
- Corporate ESG Procurement Targets Accelerating Fleet Electrification
- Limited Availability of Depot DC Fast Charging
For complete list of drivers and restraints, kindly check the Table Of Contents.
Segment Analysis
Internal combustion engines accounted for the largest 52.63% share of the United States vans market in 2025. Fleet operators continue to favor these models for rural routes that lack charging infrastructure. Hybrid and electric vans, however, register the fastest 17.11% CAGR to 2031 as falling battery costs and zero-emission rules combine with predictable urban duty cycles. Diesel and alternative fuels remain niche options, but shifting regulatory frameworks steadily erode their long-term prospects.
Hybrid-electric adoption benefits from simplified drivetrains and lower maintenance, while gasoline units rely on ubiquitous refueling and lower entry costs. Fleet procurement strategies increasingly pair electric vans with telematics to monitor utilization, ensuring that high-mileage routes realize rapid payback. Over the forecast window, the propulsion mix gradually shifts toward electricity without fully displacing gasoline in remote territories. Market share realignment will therefore be incremental but consistent.
Cargo vans led with 62.25% of the United States vans market share in 2025, as e-commerce logistics and tradespeople require secure storage. Standard body dimensions and modular upfits drive high production volumes and competitive pricing. Passenger vans, though on a smaller scale, are projected to grow at an 11.35% CAGR to 2031 because shuttle services, tourism, and van-life enthusiasts seek flexible seating with extended range capability.
Future growth for cargo variants will remain linked to warehouse expansion and parcel density, while public-transit shuttles and corporate transport spur passenger demand. Upfit ecosystems already adjust to electric chassis for both configurations, supporting smooth transitions. Manufacturers that balance cargo capacity with passenger comfort will seize mixed-use opportunities. The product mix thus broadens without undermining cargo's leadership.
Complete Report Scope:
- By Propulsion Type
- Hybrid and Electric Vehicles
- BEV
- PHEV
- HEV
- FCEV
- Internal Combustion Engine
- Diesel
- Gasoline
- CNG and Others
- Hybrid and Electric Vehicles
- By Vehicle Type
- Cargo Van
- Passenger Van
- Specialty Van
- By End-User
- Last-Mile Delivery and Parcel
- Field Services and Utilities
- Rental and Leasing Fleets
- Recreational and Van-Life
- Government and Municipal Fleets
- Corporate Passenger Transport
- By Tonnage Capacity
- Up to 2 Tons
- 2 to 3 Tons
- 3 to 5.5 Tons
- Above 5.5 Tons
- By Battery Range (EV only)
- Up to 100 miles
- 100 to 200 miles
- Above 200 miles
- By State
- Alabama
- Alaska
- Arizona
- Arkansas
- California
- Colorado
- Connecticut
- Delaware
- Florida
- Georgia
- Hawaii
- Idaho
- Illinois
- Indiana
- Iowa
- Kansas
- Kentucky
- Louisiana
- Maine
- Maryland
- Massachusetts
- Michigan
- Minnesota
- Mississippi
- Missouri
- Montana
- Nebraska
- Nevada
- New Hampshire
- New Jersey
- New Mexico
- New York
- North Carolina
- North Dakota
- Ohio
- Oklahoma
- Oregon
- Pennsylvania
- Rhode Island
- South Carolina
- South Dakota
- Tennessee
- Texas
- Utah
- Vermont
- Virginia
- Washington
- West Virginia
- Wisconsin
- Wyoming
List of Companies Covered in this Report:
- Ford Motor Company
- General Motors Co.
- Daimler Trucks AG
- Stellantis N.V
- Nissan Motor Co. Ltd.
- Rivian Automotive, Inc.
- Workhorse Group Inc.
- Volkswagen Group
- Bollinger Motors
- Winnebago Industries
- Phoenix Motorcars
- GreenPower Motor Co.
- Lion Electric Co.
- Toyota Motor Corp. (Sienna Commercial)
- Isuzu Motors Ltd. (Walk-in Vans)
Additional Benefits:
- The market estimate (ME) sheet in Excel format
- 3 months of analyst support
TABLE OF CONTENTS
1 Introduction
- 1.1 Study Assumptions and Market Definition
- 1.2 Scope of the Study
2 Research Methodology
3 Executive Summary
4 Key Industry Trends
- 4.1 Urbanization, Population and Vehicle/Transit Demand
- 4.2 EV Penetration in Van Market
- 4.3 Fuel vs Electricity Price Spread (Per km, ICE vs EV)
- 4.4 EV vs ICE Total Cost of Ownership (TCO) Gap
- 4.5 Financing and Ownership Models (Loans, Leasing, Subscription)
- 4.6 Battery Chemistry Mix and Pack Energy Density (LFP vs NMC etc.)
- 4.7 Home, Workplace and Public Charger Access / Density
- 4.8 Fast-Charging Network Coverage and Power Bands
- 4.9 Alternative Fuels Infrastructure (Hydrogen for FCEVs)
- 4.10 Subsidy and Consumer Incentive Value (Purchase, Tax, Toll/Parking Benefits)
- 4.11 OEM EV Line-up and Model Pipeline
- 4.12 Value-Chain and Distribution-Channel Analysis
- 4.13 Regulatory, Fiscal and Industrial Policy Framework
5 Market Landscape
- 5.1 Market Overview
- 5.2 Market Drivers
- 5.2.1 Accelerating Parcel E-Commerce Driving Urban Last-Mile Van Demand
- 5.2.2 Federal and State Zero-Emission Mandates for Commercial Vehicles
- 5.2.3 Declining LFP Battery Costs Enabling Larger Van Packs
- 5.2.4 Corporate ESG Procurement Targets Accelerating Fleet Electrification
- 5.2.5 OEM Electrified Chassis Platforms, Reducing Up-Fit Complexity for Fleets
- 5.2.6 Rise of Van-Life and Remote Work Culture Boosting Recreational Conversions
- 5.3 Market Restraints
- 5.3.1 High Up-Front Price Premium of Electric Vans Vs ICE Vans
- 5.3.2 Limited Availability of Depot DC Fast-Charging
- 5.3.3 Payload Penalties from Heavy Battery Packs
- 5.3.4 Uncertain Residual Values for Used Electric Vans
- 5.4 Value / Supply-Chain Analysis
- 5.5 Regulatory Landscape
- 5.6 Technological Outlook
- 5.7 Porter's Five Forces
- 5.7.1 Threat of New Entrants
- 5.7.2 Bargaining Power of Suppliers
- 5.7.3 Bargaining Power of Buyers
- 5.7.4 Threat of Substitutes
- 5.7.5 Competitive Rivalry
- 5.8 Pricing Analysis
6 Market Size and Growth Forecasts (Value and Volume)
- 6.1 By Propulsion Type
- 6.1.1 Hybrid and Electric Vehicles
- 6.1.1.1 BEV
- 6.1.1.2 PHEV
- 6.1.1.3 HEV
- 6.1.1.4 FCEV
- 6.1.2 Internal Combustion Engine
- 6.1.2.1 Diesel
- 6.1.2.2 Gasoline
- 6.1.2.3 CNG and Others
- 6.1.1 Hybrid and Electric Vehicles
- 6.2 By Vehicle Type
- 6.2.1 Cargo Van
- 6.2.2 Passenger Van
- 6.2.3 Specialty Van
- 6.3 By End-User
- 6.3.1 Last-Mile Delivery and Parcel
- 6.3.2 Field Services and Utilities
- 6.3.3 Rental and Leasing Fleets
- 6.3.4 Recreational and Van-Life
- 6.3.5 Government and Municipal Fleets
- 6.3.6 Corporate Passenger Transport
- 6.4 By Tonnage Capacity
- 6.4.1 Up to 2 Tons
- 6.4.2 2 to 3 Tons
- 6.4.3 3 to 5.5 Tons
- 6.4.4 Above 5.5 Tons
- 6.5 By Battery Range (EV only)
- 6.5.1 Up to 100 miles
- 6.5.2 100 to 200 miles
- 6.5.3 Above 200 miles
- 6.6 By State
- 6.6.1 Alabama
- 6.6.2 Alaska
- 6.6.3 Arizona
- 6.6.4 Arkansas
- 6.6.5 California
- 6.6.6 Colorado
- 6.6.7 Connecticut
- 6.6.8 Delaware
- 6.6.9 Florida
- 6.6.10 Georgia
- 6.6.11 Hawaii
- 6.6.12 Idaho
- 6.6.13 Illinois
- 6.6.14 Indiana
- 6.6.15 Iowa
- 6.6.16 Kansas
- 6.6.17 Kentucky
- 6.6.18 Louisiana
- 6.6.19 Maine
- 6.6.20 Maryland
- 6.6.21 Massachusetts
- 6.6.22 Michigan
- 6.6.23 Minnesota
- 6.6.24 Mississippi
- 6.6.25 Missouri
- 6.6.26 Montana
- 6.6.27 Nebraska
- 6.6.28 Nevada
- 6.6.29 New Hampshire
- 6.6.30 New Jersey
- 6.6.31 New Mexico
- 6.6.32 New York
- 6.6.33 North Carolina
- 6.6.34 North Dakota
- 6.6.35 Ohio
- 6.6.36 Oklahoma
- 6.6.37 Oregon
- 6.6.38 Pennsylvania
- 6.6.39 Rhode Island
- 6.6.40 South Carolina
- 6.6.41 South Dakota
- 6.6.42 Tennessee
- 6.6.43 Texas
- 6.6.44 Utah
- 6.6.45 Vermont
- 6.6.46 Virginia
- 6.6.47 Washington
- 6.6.48 West Virginia
- 6.6.49 Wisconsin
- 6.6.50 Wyoming
7 Competitive Landscape
- 7.1 Market Concentration
- 7.2 Strategic Moves
- 7.3 Market Share Analysis
- 7.4 Company Profiles (Includes Global level Overview, Market level overview, Core Segments, Financials as available, Strategic Information, Market Rank/Share for key companies, Products and Services, and Recent Developments)
- 7.4.1 Ford Motor Company
- 7.4.2 General Motors Co.
- 7.4.3 Daimler Trucks AG
- 7.4.4 Stellantis N.V
- 7.4.5 Nissan Motor Co. Ltd.
- 7.4.6 Rivian Automotive, Inc.
- 7.4.7 Workhorse Group Inc.
- 7.4.8 Volkswagen Group
- 7.4.9 Bollinger Motors
- 7.4.10 Winnebago Industries
- 7.4.11 Phoenix Motorcars
- 7.4.12 GreenPower Motor Co.
- 7.4.13 Lion Electric Co.
- 7.4.14 Toyota Motor Corp. (Sienna Commercial)
- 7.4.15 Isuzu Motors Ltd. (Walk-in Vans)
8 Market Opportunities and Future Outlook
- 8.1 White-space and Unmet-Need Assessment
9 Key Strategic Questions for CEOs

