
PUBLISHER: Mordor Intelligence | PRODUCT CODE: 1851391

PUBLISHER: Mordor Intelligence | PRODUCT CODE: 1851391
United States Solar Energy - Market Share Analysis, Industry Trends & Statistics, Growth Forecasts (2025 - 2030)
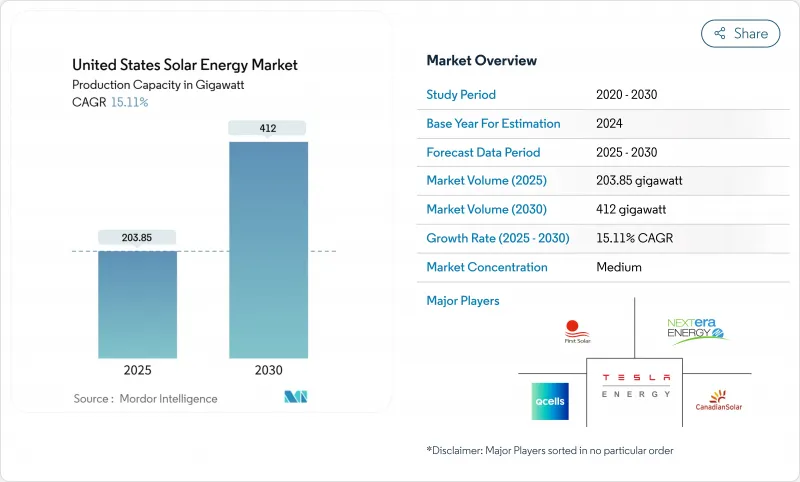
The United States Solar Energy Market size in terms of installed base is expected to grow from 203.85 gigawatt in 2025 to 412 gigawatt by 2030, at a CAGR of 15.11% during the forecast period (2025-2030).
At this scale, the United States solar energy market size for 2025 positions solar as the country's fastest-growing source of new electric capacity, with photovoltaic (PV) installations representing 53% of all generation additions logged during 2024 .Growth rests on three pillars: stable 10-year tax incentives under the Inflation Reduction Act (IRA), a swelling domestic manufacturing base that can now supply 70% of module demand, and corporate demand for low-carbon power purchase agreements. Developers continue to favor utility-scale projects because levelized costs have fallen below USD 40/MWh in high-irradiance regions, yet distributed generation is accelerating as lenders roll out zero-down financing that cuts payback periods to fewer than seven years in many states. Interconnection queues and transmission congestion remain the chief speed bumps, but planned grid investments and the adoption of hybrid solar-plus-storage plants are expected to ease curtailment pressures from 2026 forward.
United States Solar Energy Market Trends and Insights
Inflation Reduction Act tax incentives accelerating utility-scale PPAs
The IRA extended the 30% investment tax credit for a decade and introduced production tax credits that offer developers a second monetization route. Paired with bonus credits for domestic content and energy communities, projects in sun-rich regions can sign long-term PPAs below USD 50/MWh, fostering deals such as Microsoft's 10.5 GW agreement with Brookfield-the largest corporate clean-power contract to date. Apprenticeship stipulations that start in 2025 are also building a skilled labor pipeline, which helps de-risk multi-gigawatt pipelines.
Grid-edge storage pairing enhancing project bankability
Hybrid solar-plus-storage plants reached 49 GW of PV and 3.6 GW of batteries in operation by end-2024. Storage raises effective capacity factors to over 40% by shifting excess midday output into evening peaks, a key advantage in CAISO and ERCOT markets. Interconnection queues already list 599 GW of proposed hybrid capacity, signifying that financiers increasingly view standalone solar as commercially sub-optimal in congested nodes.
Interconnection queue bottlenecks lengthening lead times
The national queue swelled to 2.6 TW in 2024, with average study times surpassing 36 months. CAISO lists more than 200 GW of solar awaiting upgrades, while ERCOT experiences similar logjams. DOE's i2X reforms will streamline cluster studies, yet most regional transmission organizations need at least two years to implement them.
Other drivers and restraints analyzed in the detailed report include:
- Corporate net-zero mandates spurring commercial & industrial PPAs
- Community-solar programs expanding access
- Section 201/301 trade actions causing price volatility
For complete list of drivers and restraints, kindly check the Table Of Contents.
Segment Analysis
Solar PV dominated the United States solar energy market in 2024, holding 92% share thanks to low module costs and mature supply chains. This position gave the segment a clear runway to scale new domestic cell lines based on TOPCon and heterojunction designs. However, concentrated solar power (CSP) offers thermal storage and process-heat attributes that PV lacks, leading to a forecast 17% CAGR for CSP through 2030 as more industrial users decarbonize heat streams. Nevada's Crescent Dunes revival and Gen3 CSP prototypes targeting 5 cents/kWh illustrate how niche adoption can still be material where direct-normal irradiance exceeds 7 kWh/m2/day.
Planned TOPCon and HJT capacity expansions exceeding 7 GW should raise domestic module efficiency from a 2024 average of 21% toward the global frontier of 25%. Even so, the short-term edge remains with PERC as producers manage ramp-up risk. CSP will likely stay concentrated in the Southwest but could gain footholds at refineries or cement plants that need 500 °C steam. As both technologies grow, the United States solar energy market size allocated to CSP may reach about 5% of total capacity by 2030, improving grid resilience through diversified generation profiles. Cost-parity targets rely on continued IRA support and streamlined permitting for high-temperature molten salt towers.
The United States Solar Energy Market Report is Segmented by Type (Solar Photovoltaic and Concentrated Solar Power), Mounting Type (Ground-Mounted, Rooftop, and Floating Solar), and End-Use (Utility-Scale, Commercial and Industrial, and Residential). The Market Sizes and Forecasts are Provided in Terms of Installed Capacity (GW).
List of Companies Covered in this Report:
- First Solar Inc.
- NextEra Energy Inc.
- SunPower Corporation
- Hanwha Q CELLS USA Corp.
- Canadian Solar Inc.
- JinkoSolar Holding Co. Ltd.
- Tesla Energy
- Sunrun Inc.
- 8minute Solar Energy
- SOLV Energy LLC
- Mortenson Construction
- Rosendin Electric Inc.
- Renewable Energy Systems Americas
- Brookfield Renewable US
- EDF Renewables North America
- Enphase Energy Inc.
- Trina Solar Ltd.
- LONGi Solar
- REC Group (REC Solar Norway AS)
- Array Technologies Inc.
- Nextracker Inc.
Additional Benefits:
- The market estimate (ME) sheet in Excel format
- 3 months of analyst support
TABLE OF CONTENTS
1 Introduction
- 1.1 Study Assumptions & Market Definition
- 1.2 Scope of the Study
2 Research Methodology
3 Executive Summary
4 Market Landscape
- 4.1 Market Overview
- 4.2 Market Drivers
- 4.2.1 Inflation Reduction Act (IRA) Tax Incentives Accelerating Utility-Scale PPAs
- 4.2.2 Grid?Edge Storage Pairing Enhancing Project Bankability
- 4.2.3 Corporate Net-Zero Mandates Spurring C&I Power-Purchase Agreements
- 4.2.4 Community-Solar Programs Expanding Access in High-Population States
- 4.2.5 Domestic Manufacturing Credits Cutting Module Import Risk
- 4.2.6 Agrivoltaics Improving Land-Use Economics in the Midwest
- 4.3 Market Restraints
- 4.3.1 Interconnection Queue Bottlenecks Increasing Lead-Times Beyond 36 Months
- 4.3.2 Section 201/301 Trade Actions Causing Module-Price Volatility
- 4.3.3 Rising Transmission Congestion Curtailing Southwest Utility Projects
- 4.3.4 Skilled-Labor Shortage Inflating EPC Costs by greater than 18 % YoY
- 4.4 Supply Chain Analysis
- 4.5 Regulatory & Policy Outlook (Federal + State)
- 4.6 Technological Outlook (TOPCon, HJT, Perovskites, Bifacial)
- 4.7 Porter's Five Forces
- 4.7.1 Threat of New Entrants
- 4.7.2 Bargaining Power of Suppliers
- 4.7.3 Bargaining Power of Buyers
- 4.7.4 Threat of Substitutes (Wind, RNG, Long-Duration Storage)
- 4.7.5 Competitive Rivalry
- 4.8 PESTLE Analysis
5 Market Size & Growth Forecasts
- 5.1 By Type
- 5.1.1 Solar Photovoltaic (PV)
- 5.1.2 Concentrated Solar Power (CSP)
- 5.2 By Mounting Type
- 5.2.1 Ground-Mounted
- 5.2.2 Rooftop
- 5.2.3 Floating Solar
- 5.3 By End-Use
- 5.3.1 Utility-Scale
- 5.3.2 Commercial and Industrial
- 5.3.3 Residential
6 Competitive Landscape
- 6.1 Market Concentration
- 6.2 Strategic Moves (M&A, Partnerships, PPAs)
- 6.3 Market Share Analysis (Market Rank/Share for key companies)
- 6.4 Company Profiles (includes Global level Overview, Market level overview, Core Segments, Financials as available, Strategic Information, Products & Services, and Recent Developments)
- 6.4.1 First Solar Inc.
- 6.4.2 NextEra Energy Inc.
- 6.4.3 SunPower Corporation
- 6.4.4 Hanwha Q CELLS USA Corp.
- 6.4.5 Canadian Solar Inc.
- 6.4.6 JinkoSolar Holding Co. Ltd.
- 6.4.7 Tesla Energy
- 6.4.8 Sunrun Inc.
- 6.4.9 8minute Solar Energy
- 6.4.10 SOLV Energy LLC
- 6.4.11 Mortenson Construction
- 6.4.12 Rosendin Electric Inc.
- 6.4.13 Renewable Energy Systems Americas
- 6.4.14 Brookfield Renewable US
- 6.4.15 EDF Renewables North America
- 6.4.16 Enphase Energy Inc.
- 6.4.17 Trina Solar Ltd.
- 6.4.18 LONGi Solar
- 6.4.19 REC Group (REC Solar Norway AS)
- 6.4.20 Array Technologies Inc.
- 6.4.21 Nextracker Inc.
7 Market Opportunities & Future Outlook
- 7.1 White-Space & Unmet-Need Assessment

