
Need help finding what you are looking for?
Contact Us
PUBLISHER: Mordor Intelligence | PRODUCT CODE: 1441696

PUBLISHER: Mordor Intelligence | PRODUCT CODE: 1441696
Freight and Logistics - Market Share Analysis, Industry Trends & Statistics, Growth Forecasts (2024 - 2029)
PUBLISHED:
PAGES: 903 Pages
DELIVERY TIME: 2-3 business days
SELECT AN OPTION
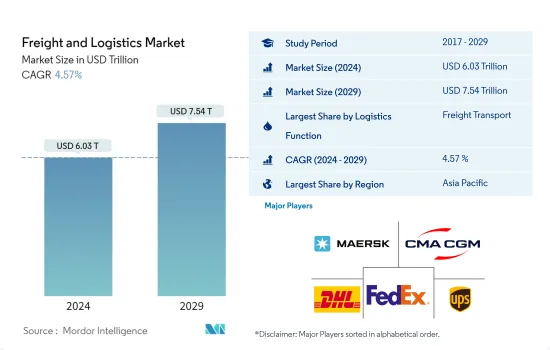
The Freight and Logistics Market size is estimated at USD 6.03 trillion in 2024, and is expected to reach USD 7.54 trillion by 2029, growing at a CAGR of 4.57% during the forecast period (2024-2029).
Asia-pacific leading the investment in airport infrastructure worldwide followed by Europe and United States
- In 2020, China led global infrastructure spending, but by May 2022, Europe and the United States had taken the lead in terms of the most costly infrastructure projects currently in progress. As of 2021, the United States boasted the world's longest railway network, surpassing Russia, China, and India, spanning over 60,000 kilometers.
- In May 2022, India led the global count with the highest number of ongoing or planned infrastructure projects, amounting to USD 25 million. Comparatively, the United States had 1,866 projects, while China had 1,175 projects. The project of the High-Speed Rail Line in California, USA, was identified as one of the most valuable infrastructure endeavors worldwide, with an estimated worth of USD 113 billion as of October 2022. Railway lines constituted a significant portion of the major infrastructure projects under development, encompassing countries such as Norway, Sweden, the United Kingdom, the United States, various regions in Asia and Southeast Asia, as well as Japan.
- In March 2022, the Asia-Pacific region led in terms of the number of airport infrastructure projects being constructed, with a total of 230 projects encompassing various components like runways and terminals. The combined value of these projects amounted to USD 227.5 billion. Following closely behind, Europe had the second-highest number of airport infrastructure projects under construction, with 178 ongoing projects valued at USD 109 billion. However, when considering the overall expenditure on airport construction worldwide, North America slightly surpassed the other regions, with a total investment of USD 117.5 billion.
Strong potential amidst uncertainties
- Asia-Pacific, North America, and Europe dominate the global freight and logistics market, along with South America and GCC. While global trucking volumes witnessed an increase of 3.6% YoY in 2022, supply chain bottlenecks continue to impact road freight transportation. Owing to significant investments in Asia-Pacific and Europe, the global rail industry witnessed a growth of 1.6% and 4.1%, respectively, in 2020 and 2022. The rail industry is expected to record a CAGR of 3% through 2027. The Russia-Ukraine war and soaring inflation impacting global growth can affect global shipping, which accounts for 80% of global trade transport. The demand for global air cargo fell by 13.6% YoY in October 2022 but recorded a 3.5% MoM increase in the same month. Hence, economic uncertainties are expected to impact the demand for air cargo during the forecast period.
- Driven by the e-commerce and manufacturing sectors, warehousing and logistics stock will likely double by 2030 to cross 700 million square feet. Leasing activity in the segment grew by 40% QoQ in Q3 2022 to amount to 9.2 million square feet. The e-commerce boom also fueled parcel volumes by 21% YoY in 2021 in 13 major economies. It is expected to record a CAGR of 8.5% through 2022-2027. The United States generated the highest revenue, while China generated 108 billion parcels in 2021.
- Logistics hubs, like Bahrain's Global Sea-to-Air Logistics Hub, launched in 2021, could provide cost-effective and faster freight transportation. In order to upgrade and modernize warehousing, 90% of Asia-Pacific warehouse operators are investing in next-gen automation tech, which is anticipated to boost the market globally in the next five years.
Global Freight and Logistics Market Trends
The North American transportation and storage market increased to 21.35% in 2022, valued at USD 642.60 billion, with investment boost
- Asia Pacific is experiencing increased demand for transportation, especially in shipping, which handles a significant portion of global seaborne trade. This region boasts nine of the world's busiest container ports and accounts for more than 40% of global surface freight transport. By 2050, freight transport demand in the region is projected to triple. Meanwhile, Germany has become a leader in the transportation and warehousing sector, surpassing France and the United Kingdom, ranking third globally in imports and exports. To improve transportation infrastructure, the German government plans to invest over EUR 12 billion (USD 12.81 billion) in federal highways and about USD 1.81 billion in waterways in 2022.
- Global foreign direct investment (FDI) flows in 2022 fell by 24%, totaling USD 1,286 billion, or a 5% decrease when excluding Luxembourg, compared to the previous year. The United States remained the top destination for FDI inflows, receiving USD 318 billion, followed by China with USD 180 billion, although at lower levels. Cross-border merger and acquisition (M&A) activity slowed down with fewer deals, while the outlook for greenfield investment remained positive.
- Transportation and storage in North America saw a significant growth boost, rising from 14.31% YoY in 2021 to 21.35% YoY in 2022, driven by increased demand for e-commerce warehousing and distribution centers. This growth encompassed various transportation facets, reaching a total value of USD 642.60 billion. In 2022, the US Department of Transportation introduced the Port Infrastructure Development Program, allocating more than USD 703 million for 41 projects in 22 states to improve port capabilities, enhance supply chain reliability, and create job opportunities.
For over a year, Russia's invasion of Ukraine, has disrupted global crude oil and petroleum product markets
- In 2022, the global average price of gasoline at the pump was 1.22 USD per litre, a 19% increase from the previous year, exceeding pre-COVID-19 levels. Following the 2021 rebound amid economic recovery, 2022 prices hiked following crude oil increase as a result of supply disruption risk amid war. Gasoline prices in Europe are the highest compared to other regions. Gasoline is particularly expensive in Iceland, Norway, Denmark, Greece, Finland, and the Netherlands at 7.6 USD per gallon.
- The Brent crude oil price rose significantly in the first half of 2022 but generally declined in the second half of the year. The Brent crude oil spot price averaged USD 100 per barrel in 2022. Total OPEC crude oil production fell from an average of 29.2 million b/d in Q3 2022 to 28.6 million b/d in Q4 2022. In 2023, OPEC crude oil production is expected to average 28.9 million barrels per day. Oil prices have peaked since last November as Russia and Saudi Arabia continue to cut a total of 1.3 million barrels a day from their output, even as global demand continues to rise to near-record levels.
- Diesel is produced from crude oil, so crude oil prices are closely linked to diesel prices. Diesel prices in the United States and globally increased rapidly in the spring of 2022 because of concerns about global diesel supply. Although crude oil prices declined in the second half of 2022, United States diesel futures prices rose again in October 2022 to USD 3.95 per gallon due to seasonal demand and diesel supply concerns for Europe. Russia has been Europe's largest supplier of diesel. In 2023, diesel prices have declined in both Europe and the United States as Europe has been able to replace most of the diesel it would have imported from Russia with imports from other regions.
Freight and Logistics Industry Overview
The Freight and Logistics Market is fragmented, with the top five companies occupying 8.53%. The major players in this market are A.P. Moller - Maersk, CMA CGM, Deutsche Post DHL Group, FedEx and United Parcel Service (sorted alphabetically).
Additional Benefits:
- The market estimate (ME) sheet in Excel format
- 3 months of analyst support
Product Code: 48024
TABLE OF CONTENTS
1 EXECUTIVE SUMMARY & KEY FINDINGS
2 REPORT OFFERS
3 INTRODUCTION
- 3.1 Study Assumptions & Market Definition
- 3.2 Scope of the Study
- 3.3 Research Methodology
4 KEY INDUSTRY TRENDS
- 4.1 Demographics
- 4.2 GDP Distribution By Economic Activity
- 4.3 GDP Growth By Economic Activity
- 4.4 Inflation
- 4.5 Economic Performance And Profile
- 4.5.1 Trends in E-Commerce Industry
- 4.5.2 Trends in Manufacturing Industry
- 4.6 Transport And Storage Sector GDP
- 4.7 Export Trends
- 4.8 Import Trends
- 4.9 Fuel Price
- 4.10 Trucking Operational Costs
- 4.11 Trucking Fleet Size By Type
- 4.12 Logistics Performance
- 4.13 Major Truck Suppliers
- 4.14 Modal Share
- 4.15 Maritime Fleet Load Carrying Capacity
- 4.16 Liner Shipping Connectivity
- 4.17 Port Calls And Performance
- 4.18 Freight Pricing Trends
- 4.19 Freight Tonnage Trends
- 4.20 Infrastructure
- 4.21 Regulatory Framework (Road and Rail)
- 4.21.1 Argentina
- 4.21.2 Australia
- 4.21.3 Brazil
- 4.21.4 Canada
- 4.21.5 Chile
- 4.21.6 China
- 4.21.7 Egypt
- 4.21.8 France
- 4.21.9 Germany
- 4.21.10 India
- 4.21.11 Indonesia
- 4.21.12 Italy
- 4.21.13 Japan
- 4.21.14 Malaysia
- 4.21.15 Mexico
- 4.21.16 Netherlands
- 4.21.17 Nigeria
- 4.21.18 Nordics
- 4.21.19 Qatar
- 4.21.20 Russia
- 4.21.21 Saudi Arabia
- 4.21.22 South Africa
- 4.21.23 Spain
- 4.21.24 Thailand
- 4.21.25 UAE
- 4.21.26 United Kingdom
- 4.21.27 United States
- 4.21.28 Vietnam
- 4.22 Regulatory Framework (Sea and Air)
- 4.22.1 Argentina
- 4.22.2 Australia
- 4.22.3 Brazil
- 4.22.4 Canada
- 4.22.5 Chile
- 4.22.6 China
- 4.22.7 Egypt
- 4.22.8 France
- 4.22.9 Germany
- 4.22.10 India
- 4.22.11 Indonesia
- 4.22.12 Italy
- 4.22.13 Japan
- 4.22.14 Malaysia
- 4.22.15 Mexico
- 4.22.16 Netherlands
- 4.22.17 Nigeria
- 4.22.18 Nordics
- 4.22.19 Qatar
- 4.22.20 Russia
- 4.22.21 Saudi Arabia
- 4.22.22 South Africa
- 4.22.23 Spain
- 4.22.24 Thailand
- 4.22.25 UAE
- 4.22.26 United Kingdom
- 4.22.27 United States
- 4.22.28 Vietnam
- 4.23 Value Chain & Distribution Channel Analysis
5 MARKET SEGMENTATION (includes 1. Market value in USD for all segments 2. Market volume for select segments viz. freight transport, CEP (courier, express, and parcel) and warehousing & storage 3.Forecasts up to 2029 and analysis of growth prospects)
- 5.1 End User Industry
- 5.1.1 Agriculture, Fishing and Forestry
- 5.1.2 Construction
- 5.1.3 Manufacturing
- 5.1.4 Oil and Gas, Mining and Quarrying
- 5.1.5 Wholesale and Retail Trade
- 5.1.6 Others
- 5.2 Logistics Function
- 5.2.1 Courier, Express and Parcel
- 5.2.1.1 By Destination Type
- 5.2.1.1.1 Domestic
- 5.2.1.1.2 International
- 5.2.2 Freight Forwarding
- 5.2.2.1 By Mode Of Transport
- 5.2.2.1.1 Air
- 5.2.2.1.2 Sea and Inland Waterways
- 5.2.2.1.3 Others
- 5.2.3 Freight Transport
- 5.2.3.1 By Mode Of Transport
- 5.2.3.1.1 Air
- 5.2.3.1.2 Pipelines
- 5.2.3.1.3 Rail
- 5.2.3.1.4 Road
- 5.2.3.1.5 Sea and Inland Waterways
- 5.2.4 Warehousing and Storage
- 5.2.4.1 By Temperature Control
- 5.2.4.1.1 Non-Temperature Controlled
- 5.2.4.1.2 Temperature Controlled
- 5.2.5 Other Services
- 5.2.1 Courier, Express and Parcel
- 5.3 Region
- 5.3.1 Africa
- 5.3.1.1 By Country
- 5.3.1.1.1 Egypt
- 5.3.1.1.2 Nigeria
- 5.3.1.1.3 South Africa
- 5.3.1.1.4 Rest of Africa
- 5.3.2 Asia Pacific
- 5.3.2.1 By Country
- 5.3.2.1.1 Australia
- 5.3.2.1.2 China
- 5.3.2.1.3 India
- 5.3.2.1.4 Indonesia
- 5.3.2.1.5 Japan
- 5.3.2.1.6 Malaysia
- 5.3.2.1.7 Thailand
- 5.3.2.1.8 Vietnam
- 5.3.2.1.9 Rest of Asia Pacific
- 5.3.3 Europe
- 5.3.3.1 By Country
- 5.3.3.1.1 Denmark
- 5.3.3.1.2 Finland
- 5.3.3.1.3 France
- 5.3.3.1.4 Germany
- 5.3.3.1.5 Iceland
- 5.3.3.1.6 Italy
- 5.3.3.1.7 Netherlands
- 5.3.3.1.8 Norway
- 5.3.3.1.9 Russia
- 5.3.3.1.10 Spain
- 5.3.3.1.11 Sweden
- 5.3.3.1.12 United Kingdom
- 5.3.3.1.13 Rest of Europe
- 5.3.4 GCC
- 5.3.4.1 By Country
- 5.3.4.1.1 Qatar
- 5.3.4.1.2 Saudi Arabia
- 5.3.4.1.3 UAE
- 5.3.4.1.4 Rest of GCC
- 5.3.5 North America
- 5.3.5.1 By Country
- 5.3.5.1.1 Canada
- 5.3.5.1.2 Mexico
- 5.3.5.1.3 United States
- 5.3.5.1.4 Rest of North America
- 5.3.6 South America
- 5.3.6.1 By Country
- 5.3.6.1.1 Argentina
- 5.3.6.1.2 Brazil
- 5.3.6.1.3 Chile
- 5.3.6.1.4 Rest of South America
- 5.3.7 Rest of the World
- 5.3.1 Africa
6 COMPETITIVE LANDSCAPE
- 6.1 Key Strategic Moves
- 6.2 Market Share Analysis
- 6.3 Company Landscape
- 6.4 Company Profiles (includes Global Level Overview, Market Level Overview, Core Business Segments, Financials, Headcount, Key Information, Market Rank, Market Share, Products and Services, and Analysis of Recent Developments).
- 6.4.1 A.P. Moller - Maersk
- 6.4.2 AllCargo Logistics Ltd
- 6.4.3 Americold
- 6.4.4 Aramex
- 6.4.5 Bollore logistics
- 6.4.6 C.H Robinson
- 6.4.7 CJ Logistics
- 6.4.8 CMA CGM
- 6.4.9 CTS Logistics Group
- 6.4.10 Culina Group
- 6.4.11 Dachser
- 6.4.12 DB Schenker
- 6.4.13 Deutsche Post DHL Group
- 6.4.14 DP World
- 6.4.15 DSV A/S (De Sammensluttede Vognmand af Air and Sea)
- 6.4.16 Expeditors International
- 6.4.17 FedEx
- 6.4.18 GEODIS
- 6.4.19 GXO Logistics
- 6.4.20 Hellmann Worldwide Logistics
- 6.4.21 Hub Group Inc
- 6.4.22 International Distributions Services
- 6.4.23 J.B.Hunt Transport Services Inc.
- 6.4.24 Japan Post Holdings Co., Ltd.
- 6.4.25 JD Logistics
- 6.4.26 Kerry Logistics
- 6.4.27 Kintetsu World Express
- 6.4.28 Kuehne + Nagel
- 6.4.29 La Poste Group
- 6.4.30 Landstar System Inc.
- 6.4.31 LOGWIN
- 6.4.32 LX International Corp
- 6.4.33 Mainfreight
- 6.4.34 NFI Industries
- 6.4.35 Nippon Yusen Kabushiki Kaisha (NYK Line)
- 6.4.36 Orient Overseas Container Line (OOCL Logistics)
- 6.4.37 Penske Logistics
- 6.4.38 Poste Italiane
- 6.4.39 Ryder Systems
- 6.4.40 Savino Del Bene
- 6.4.41 SF Express
- 6.4.42 Sinotrans Limited
- 6.4.43 TIBA Group
- 6.4.44 Total Quality Logistics
- 6.4.45 Uber Technologies Inc
- 6.4.46 United Parcel Service
- 6.4.47 XPO Logistics
- 6.4.48 Yamato Holdings
7 KEY STRATEGIC QUESTIONS FOR FREIGHT AND LOGISTICS CEOS
8 APPENDIX
- 8.1 Global Overview
- 8.1.1 Overview
- 8.1.2 Porter's Five Forces Framework
- 8.1.3 Global Value Chain Analysis
- 8.1.4 Market Dynamics (Market Drivers, Restraints & Opportunities)
- 8.1.5 Technological Advancements
- 8.2 Sources & References
- 8.3 List of Tables & Figures
- 8.4 Primary Insights
- 8.5 Data Pack
- 8.6 Glossary of Terms
- 8.7 Currency Exchange Rate
Have a question?


SELECT AN OPTION
Have a question?
Questions? Please give us a call or visit the contact form.