
PUBLISHER: Mordor Intelligence | PRODUCT CODE: 1906859

PUBLISHER: Mordor Intelligence | PRODUCT CODE: 1906859
North America Freight And Logistics - Market Share Analysis, Industry Trends & Statistics, Growth Forecasts (2026 - 2031)
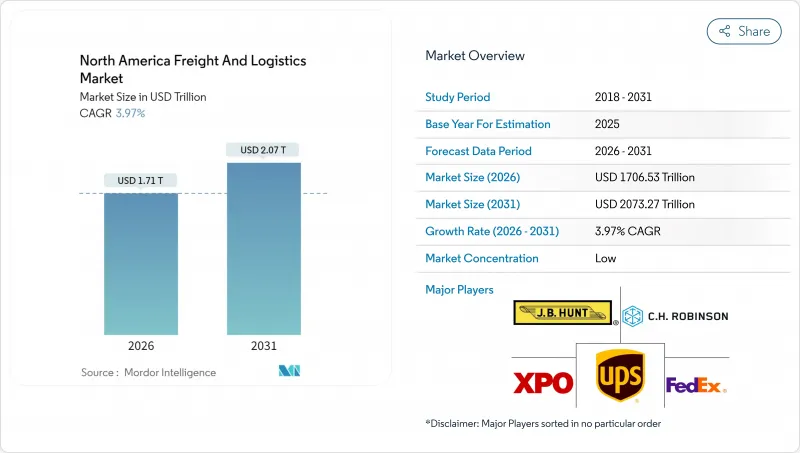
The North America freight and logistics market was valued at USD 1641.37 billion in 2025 and estimated to grow from USD 1706.53 billion in 2026 to reach USD 2073.27 billion by 2031, at a CAGR of 3.97% during the forecast period (2026-2031).
Robust USMCA-driven trade integration, surging e-commerce parcel volumes, and federally funded infrastructure modernization projects are reinforcing the strategic importance of the corridor and underpinning investment flows. Cross-border trade reached record levels in 2024, with Canada-U.S. commerce hitting USD 780 billion and Mexico-U.S. flows touching USD 807.8 billion. Accelerated near-shoring to Mexico, complemented by USD 110 billion in U.S. transportation funding, is reshaping freight corridors and injecting technology-led efficiencies. At the same time, labor shortages and cybersecurity threats are constraining capacity, spurring automation adoption, and heightening the need for resilient networks. Against this backdrop, the North America freight and logistics market is poised for steady, technology-enabled growth despite short-term operational headwinds.
North America Freight And Logistics Market Trends and Insights
Accelerated E-Commerce Parcel Volumes Drive Last-Mile Innovation
E-commerce penetration reached 15.6% of retail sales in Q2 2024, generating more than 24 billion parcels annually and outstripping legacy last-mile capacity. Operators responded by deploying micro-fulfillment hubs within city limits, piloting autonomous delivery vans and tapping gig-economy couriers to flex capacity during peak periods that now account for 40% of yearly throughput. Same-day and next-day expectations have unlocked a USD 12 billion urban logistics real-estate opportunity, evidenced by the 150 new delivery stations Amazon opened in 2024. Regulators in both the United States and Canada have cleared limited drone corridors, signaling institutional backing for alternative modes. Higher parcel density-up 35% since 2022-has intensified curbside congestion, prompting carriers to test consolidated drop-off models that lower vehicle dwell times and emissions.
USMCA Trade Integration Reshapes Cross-Border Logistics Networks
USMCA enabled USD 1.6 trillion in trilateral trade during 2024, with freight flows rising 8.2% year over year. Automated customs platforms now trim clearance times by up to 30% at crossings such as Laredo and Detroit, while Mexican exports of USD 455 billion are generating complex reverse-logistics needs for high-value components. The 2024 Canadian Pacific Kansas City rail merger established the first single-line service that links Canadian ports directly to Mexican industrial zones, compressing transit times and minimizing handoffs. Enhanced digital trade provisions support real-time cargo tracking, further reducing border dwell times to roughly 90 minutes at high-volume lanes. Investments in cold-chain and automotive logistics centers on both sides of the border highlight the strategic depth of the North America freight and logistics market.
Labor Shortages Constrain Operational Capacity
More than 80,000 commercial driving positions and 600,000 warehouse roles remained unfilled across North America in 2024, with churn surpassing 75% in hot spots such as Southern California and the Texas Triangle. Wage bills climbed 15-20% as carriers competed for talent, yet the workforce median age crept past 47 years, threatening long-term capacity. Automation spend reached USD 4.8 billion in 2024 as firms implemented robotic sortation and autonomous yard trucks. Federal waivers allowing younger drivers to haul interstate freight are in place, but meaningful labor relief is unlikely before 2026.
Other drivers and restraints analyzed in the detailed report include:
- Infrastructure Investment Modernizes Freight Corridors
- Near-shoring Manufacturing Transforms Mexico's Logistics Landscape
- Infrastructure Bottlenecks Limit Growth Potential
For complete list of drivers and restraints, kindly check the Table Of Contents.
Segment Analysis
Manufacturing's 28.95% share signals entrenched just-in-time practices and complex returns flows. Semiconductor, electric-vehicle and medical-device producers are driving requirements for controlled environments and secured transport. Even amid near-shoring, manufacturers are demanding end-to-end visibility tools that integrate production milestones with freight milestones, shrinking buffer inventories.
Wholesale and retail trade, propelled by omnichannel fulfillment, is the fastest mover at a 4.21% CAGR (2026-2031). Retailers are decentralizing inventory into micro-fulfillment sites to cut delivery times while blending store and online stock pools. Temperature-controlled grocery logistics are seeing heightened interest, supporting further cold-chain investment in the North America freight and logistics market. As reverse-logistics volumes rise, carriers that can quickly triage returns for resale or recycling will gain share.
Freight Transport controlled 62.58% of revenue in 2025, reaffirming its backbone role within the North America freight and logistics market. Road haulage dominates this function, yet rail intermodal share is creeping upward as shippers prioritize cost and sustainability. The segment is leveraging telematics for predictive maintenance, trimming unplanned downtime, and tightening delivery windows. Automation pilots now span long-haul platooning and yard-hostler robotics, pointing to a gradual blend of manned and autonomous assets through the decade.
CEP services, while smaller, are expanding at a 4.4% CAGR (2026-2031) thanks to e-commerce. Same-day coverage is now feasible for 75% of U.S. households, underpinned by dense urban networks and algorithmic route optimization. Parcel carriers are experimenting with dynamic pricing engines that match capacity to real-time demand. Combined, these dynamics reinforce that innovation in first- and last-mile delivery will shape competitive positioning across the broader North America freight and logistics market.
The North America Freight and Logistics Market Report is Segmented by Logistics Function (Courier, Express, and Parcel, Freight Forwarding, Freight Transport, Warehousing and Storage, and Other Services), End User Industry (Agriculture, Fishing, and Forestry, Construction, Manufacturing, Wholesale and Retail Trade, and More), and Geography (United States, Canada, and More). The Market Forecasts are Provided in Terms of Value (USD).
List of Companies Covered in this Report:
- A.P. Moller-Maersk
- AIT Worldwide Logistics
- Americold
- ArcBest
- Arrive Logistics
- Ascent Global Logistics
- Berkshire Hathaway Inc. (Including BNSF Railway Company)
- Brookfield Infrastructure Partners L.P. (Including Genesee & Wyoming Inc.)
- Burris Logistics
- C.H. Robinson
- Canada Post Corporation (Including Purolator)
- Canadian National Railway
- Canadian Pacific Railway
- Capstone Logistics LLC
- Congebec
- CSX Corporation
- DHL Group
- DSV A/S (Including DB Schenker)
- Excel Group
- Expeditors International of Washington, Inc.
- Fastfrate Inc.
- FedEx
- Fomento Economico Mexicano, S.A.B. de C.V.
- GEODIS
- Grupo Mexico
- GXO Logistics, Inc.
- Hub Group Inc.
- J.B. Hunt Transport, Inc.
- Knight-Swift Transportation Holdings, Inc.
- Kuehne+Nagel
- Landstar System, Inc.
- Lineage, Inc.
- M3 Transport
- Mactrans Logistics
- MODE Global LLC
- NFI Industries
- Nippon Express Holdings
- Norfolk Southern Railway
- Old Dominion Freight Line
- Omni Logistics
- OnTrac
- Patriot Rail Company
- Penske Corporation (including Penske Logistics)
- Polaris Worldwide Logistics
- Ryder System, Inc.
- Schneider National, Inc.
- SF Express (KEX-SF)
- TFI International Inc.
- Total Quality Logistics, LLC
- Transportation Insight Holding
- Traxion
- Uber Technologies Inc.
- Union Pacific Railroad
- United Parcel Service of America, Inc. (UPS)
- Werner Enterprises, Inc.
- XPO, Inc.
Additional Benefits:
- The market estimate (ME) sheet in Excel format
- 3 months of analyst support
TABLE OF CONTENTS
1 Introduction
- 1.1 Study Assumptions and Market Definition
- 1.2 Scope of the Study
2 Research Methodology
3 Executive Summary
4 Market Landscape
- 4.1 Market Overview
- 4.2 Demographics
- 4.3 GDP Distribution by Economic Activity
- 4.4 GDP Growth by Economic Activity
- 4.5 Inflation
- 4.6 Economic Performance and Profile
- 4.6.1 Trends in E-Commerce Industry
- 4.6.2 Trends in Manufacturing Industry
- 4.7 Transport and Storage Sector GDP
- 4.8 Export Trends
- 4.9 Import Trends
- 4.10 Fuel Price
- 4.11 Trucking Operational Costs
- 4.12 Trucking Fleet Size by Type
- 4.13 Major Truck Suppliers
- 4.14 Logistics Performance
- 4.15 Modal Share
- 4.16 Maritime Fleet Load Carrying Capacity
- 4.17 Liner Shipping Connectivity
- 4.18 Port Calls and Performance
- 4.19 Freight Pricing Trends
- 4.20 Freight Tonnage Trends
- 4.21 Infrastructure
- 4.22 Regulatory Framework (Road and Rail)
- 4.22.1 Canada
- 4.22.2 Mexico
- 4.22.3 United States
- 4.23 Regulatory Framework (Sea and Air)
- 4.23.1 Canada
- 4.23.2 Mexico
- 4.23.3 United States
- 4.24 Value Chain and Distribution Channel Analysis
- 4.25 Market Drivers
- 4.25.1 Accelerated E-Commerce Parcel Volumes
- 4.25.2 USMCA-Driven Cross-Border Trade Integration
- 4.25.3 U.S. Infrastructure Investment and Jobs Act Funding
- 4.25.4 Near-Shoring of Manufacturing to Mexico
- 4.25.5 Digital Freight Marketplaces and API Connectivity
- 4.25.6 Expansion of Temperature-Controlled (Cold-Chain) Logistics
- 4.26 Market Restraints
- 4.26.1 Driver and Warehouse Labor Shortages
- 4.26.2 Port Congestion and Rail Capacity Bottlenecks
- 4.26.3 Rising Trucking-Sector Insurance Premiums
- 4.26.4 Cyber-Security Vulnerabilities in Connected Fleets
- 4.27 Technology Innovations in the Market
- 4.28 Porter's Five Forces Analysis
- 4.28.1 Threat of New Entrants
- 4.28.2 Bargaining Power of Buyers
- 4.28.3 Bargaining Power of Suppliers
- 4.28.4 Threat of Substitutes
- 4.28.5 Competitive Rivalry
5 Market Size and Growth Forecasts (Value, USD)
- 5.1 End User Industry
- 5.1.1 Agriculture, Fishing, and Forestry
- 5.1.2 Construction
- 5.1.3 Manufacturing
- 5.1.4 Oil and Gas, Mining and Quarrying
- 5.1.5 Wholesale and Retail Trade
- 5.1.6 Others
- 5.2 Logistics Function
- 5.2.1 Courier, Express, and Parcel (CEP)
- 5.2.1.1 By Destination Type
- 5.2.1.1.1 Domestic
- 5.2.1.1.2 International
- 5.2.1.1 By Destination Type
- 5.2.2 Freight Forwarding
- 5.2.2.1 By Mode of Transport
- 5.2.2.1.1 Air
- 5.2.2.1.2 Sea and Inland Waterways
- 5.2.2.1.3 Others
- 5.2.2.1 By Mode of Transport
- 5.2.3 Freight Transport
- 5.2.3.1 By Mode of Transport
- 5.2.3.1.1 Air
- 5.2.3.1.2 Pipelines
- 5.2.3.1.3 Rail
- 5.2.3.1.4 Road
- 5.2.3.1.5 Sea and Inland Waterways
- 5.2.3.1 By Mode of Transport
- 5.2.4 Warehousing and Storage
- 5.2.4.1 By Temperature Control
- 5.2.4.1.1 Non-Temperature-Controlled
- 5.2.4.1.2 Temperature-Controlled
- 5.2.4.1 By Temperature Control
- 5.2.5 Other Services
- 5.2.1 Courier, Express, and Parcel (CEP)
- 5.3 Country
- 5.3.1 Canada
- 5.3.2 Mexico
- 5.3.3 United States
- 5.3.4 Rest of North America
6 Competitive Landscape
- 6.1 Market Concentration
- 6.2 Key Strategic Moves
- 6.3 Market Share Analysis
- 6.4 Company Profiles (Includes Global Level Overview, Market Level Overview, Core Segments, Financials as Available, Strategic Information, Market Rank/Share for Key Companies, Products and Services, and Recent Developments)
- 6.4.1 A.P. Moller-Maersk
- 6.4.2 AIT Worldwide Logistics
- 6.4.3 Americold
- 6.4.4 ArcBest
- 6.4.5 Arrive Logistics
- 6.4.6 Ascent Global Logistics
- 6.4.7 Berkshire Hathaway Inc. (Including BNSF Railway Company)
- 6.4.8 Brookfield Infrastructure Partners L.P. (Including Genesee & Wyoming Inc.)
- 6.4.9 Burris Logistics
- 6.4.10 C.H. Robinson
- 6.4.11 Canada Post Corporation (Including Purolator)
- 6.4.12 Canadian National Railway
- 6.4.13 Canadian Pacific Railway
- 6.4.14 Capstone Logistics LLC
- 6.4.15 Congebec
- 6.4.16 CSX Corporation
- 6.4.17 DHL Group
- 6.4.18 DSV A/S (Including DB Schenker)
- 6.4.19 Excel Group
- 6.4.20 Expeditors International of Washington, Inc.
- 6.4.21 Fastfrate Inc.
- 6.4.22 FedEx
- 6.4.23 Fomento Economico Mexicano, S.A.B. de C.V.
- 6.4.24 GEODIS
- 6.4.25 Grupo Mexico
- 6.4.26 GXO Logistics, Inc.
- 6.4.27 Hub Group Inc.
- 6.4.28 J.B. Hunt Transport, Inc.
- 6.4.29 Knight-Swift Transportation Holdings, Inc.
- 6.4.30 Kuehne+Nagel
- 6.4.31 Landstar System, Inc.
- 6.4.32 Lineage, Inc.
- 6.4.33 M3 Transport
- 6.4.34 Mactrans Logistics
- 6.4.35 MODE Global LLC
- 6.4.36 NFI Industries
- 6.4.37 Nippon Express Holdings
- 6.4.38 Norfolk Southern Railway
- 6.4.39 Old Dominion Freight Line
- 6.4.40 Omni Logistics
- 6.4.41 OnTrac
- 6.4.42 Patriot Rail Company
- 6.4.43 Penske Corporation (including Penske Logistics)
- 6.4.44 Polaris Worldwide Logistics
- 6.4.45 Ryder System, Inc.
- 6.4.46 Schneider National, Inc.
- 6.4.47 SF Express (KEX-SF)
- 6.4.48 TFI International Inc.
- 6.4.49 Total Quality Logistics, LLC
- 6.4.50 Transportation Insight Holding
- 6.4.51 Traxion
- 6.4.52 Uber Technologies Inc.
- 6.4.53 Union Pacific Railroad
- 6.4.54 United Parcel Service of America, Inc. (UPS)
- 6.4.55 Werner Enterprises, Inc.
- 6.4.56 XPO, Inc.
7 Market Opportunities and Future Outlook
- 7.1 White-space and Unmet-Need Assessment

