
PUBLISHER: Mordor Intelligence | PRODUCT CODE: 1937385

PUBLISHER: Mordor Intelligence | PRODUCT CODE: 1937385
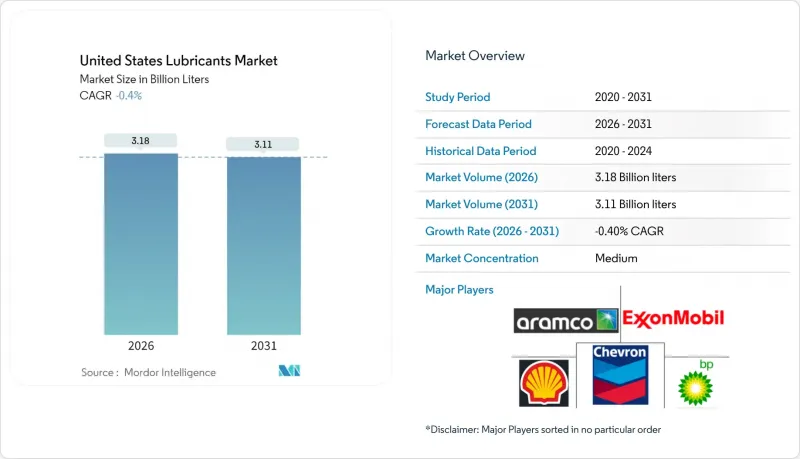
United States Lubricants - Market Share Analysis, Industry Trends & Statistics, Growth Forecasts (2026 - 2031)
The United States Lubricants Market is expected to grow from USD 3.19 billion liters in 2025 to USD 3.18 billion liters in 2026 and is forecast to reach USD 3.11 billion liters by 2031 at -0.40% CAGR over 2026-2031.
This contraction signals a shift from the historical expansion path, driven primarily by electrification, premium product migration, and tightening environmental regulations. Escalating electric-vehicle penetration removes large volumes of engine oil demand; however, the pivot toward Group II/III and synthetic formulations lifts average selling prices and cushions the revenue impact. Longer drain intervals enabled by predictive-maintenance technology reduce lubricant consumption but intensify the need for high-performance products. At the same time, circular-economy programs centered on re-refined base oils gain regulatory support, especially in California and Texas, enhancing supply resilience. Consolidation pressures, raw material volatility, and PFAS compliance costs prompt smaller blenders to exit or merge, while integrated majors leverage vertical integration and export channels through the Gulf Coast.
United States Lubricants Market Trends and Insights
Rising Vehicle-Parc Age and Miles Driven
The average vehicle age reached 12.5 years in 2024, and the fastest-growing cohort is now cars older than 16 years. Older engines require more viscous oils and shorter service intervals, which can increase per-unit lubricant demand even as electrification expands. Rural and suburban regions with lower EV uptake preserve conventional motor oil consumption, generating geographic demand pockets that partially offset urban declines. Mixed-age commercial fleets report higher lubricant use per mile once vehicles surpass the 10-year mark. Blenders supplying high-mileage formulations, therefore, secure resilient volume streams despite nationwide contraction.
Manufacturing and Construction Rebound
Federal infrastructure spending and near-shoring accelerate the sale of construction equipment, thereby bolstering demand for hydraulic fluids, gear oils, and metalworking fluids. Reshored automotive-parts machining lifts metalworking-fluid throughput in Midwest corridors, while power-sector modernization boosts turbine- and transformer-oil requirements. Although new machines employ more efficient lubrication systems, overall industrial activity growth still produces incremental volumes, sustaining the US lubricants market in heavy-equipment hubs.
Accelerating EV Penetration Curbing ICE-Oil Volumes
EV sales climbed, each removing roughly 15-20 liters of annual engine oil demand. California's EV share of new sales leads the nation, creating steep regional volume erosion that propagates through federal incentives. EV-specific fluids for drivetrains and thermal management account for less than 10% of ICE lubricant demand, resulting in a significant net decline. Legacy blending plants face asset utilization challenges, particularly those without specialty product diversification.
Other drivers and restraints analyzed in the detailed report include:
- Shift Toward Group II/III and Synthetic Formulations
- Expansion of Re-refined Base-Oil Circular Programs
- Base-Oil Price Volatility Squeezing Blender Margins
For complete list of drivers and restraints, kindly check the Table Of Contents.
Segment Analysis
Automotive engine oil retained 40.05% of the US lubricants market share in 2025, yet its volume trajectory is negative due to EV substitution. Industrial engine oil, with a 0.07% CAGR, benefits from onshoring and backup generator deployments. Transmission fluids and gear oils benefit from equipment life extensions, while hydraulic fluids remain tied to the cycles of construction equipment. Metalworking fluid growth in Midwest machining shops counters declines from ICE engine-component production. Specialty greases experience cost pressure from lithium soap scarcity, accelerating a shift to calcium-sulfonate and polyurea chemistries. Process oils for rubber and plastics stay stable, whereas turbine and transformer oils expand with grid modernization. Suppliers with multi-product breadth, therefore, outpace single-category competitors in the evolving US lubricants market.
A premiumization narrative underlies the shift in mix. OEM approvals for low-viscosity, high-VI grades increasingly require Group III or PAO bases, prompting formulators to expand their domestic Group III production on the Gulf Coast. Innovation pipelines target EV thermal-management fluids and immersion-cooling lubricants for data centers, further diversifying revenue streams as traditional engine-oil volumes shrink.
The United States Lubricants Market Report is Segmented by Product Type (Automotive Engine Oil, Industrial Engine Oil, Transmission Fluids, Gear Oil, Brake Fluids, Hydraulic Fluids, and More), End-User Industry (Automotive, Marine, Aerospace, Heavy Equipment, and Industrial), and Base Stock Type (Mineral Oil-Based, Synthetic, Semi-Synthetic, and Bio-Based Lubricants). The Market Forecasts are Provided in Terms of Volume (Litres).
List of Companies Covered in this Report:
- AMSOIL INC.
- BP p.l.c
- Calumet Inc.
- Chevron Corporation
- CITGO Petroleum Lubricants
- Exxon Mobil Corporation
- FUCHS
- Gulf Oil International
- HF Sinclair Corporation
- Idemitsu Lubricants America
- Lucas Oil Products Inc.
- Motul USA
- Penzoil
- Phillips 66 Company
- Quaker Chemical Corporation
- Renewable Lubricants Inc.
- Saudi Arabian Co. Ltd
- Shell plc
- TotalEnergies
Additional Benefits:
- The market estimate (ME) sheet in Excel format
- 3 months of analyst support
TABLE OF CONTENTS
1 Introduction
- 1.1 Study Assumptions and Market Definition
- 1.2 Scope of the Study
2 Research Methodology
3 Executive Summary
4 Market Landscape
- 4.1 Market Overview
- 4.2 Market Drivers
- 4.2.1 Rising vehicle-parc age and miles driven
- 4.2.2 Manufacturing and construction rebound
- 4.2.3 Shift toward Group II/III and synthetic formulations
- 4.2.4 Expansion of re-refined base-oil circular programs
- 4.2.5 AI-enabled predictive-maintenance demand for premium lubricants
- 4.3 Market Restraints
- 4.3.1 Accelerating EV penetration curbing ICE-oil volumes
- 4.3.2 Base-oil price volatility squeezing blender margins
- 4.3.3 Lithium-soap thickener scarcity inflating grease costs
- 4.4 Value Chain Analysis
- 4.5 Regulatory Framework
- 4.6 End-User Trends
- 4.6.1 Automotive Industry
- 4.6.2 Manufacturing Industry
- 4.6.3 Power Generation Industry
- 4.7 Porter's Five Forces
- 4.7.1 Bargaining Power of Suppliers
- 4.7.2 Bargaining Power of Buyers
- 4.7.3 Threat of New Entrants
- 4.7.4 Threat of Substitutes
- 4.7.5 Degree of Competition
5 Market Size and Growth Forecasts (Volume)
- 5.1 By Product Type
- 5.1.1 Automotive Engine Oil
- 5.1.2 Industrial Engine Oil
- 5.1.3 Transmission Fluids
- 5.1.4 Gear Oil
- 5.1.5 Brake Fluids
- 5.1.6 Hydraulic Fluids
- 5.1.7 Greases
- 5.1.8 Process Oil (Including Rubber Process Oil and White Oil)
- 5.1.9 Metalworking Fluids
- 5.1.10 Turbine Oil
- 5.1.11 Transformer Oil
- 5.1.12 Other Product Types
- 5.2 By End-user Industry
- 5.2.1 Automotive
- 5.2.1.1 Passenger Vehicles
- 5.2.1.2 Commercial Vehicles
- 5.2.1.3 Two-Wheelers
- 5.2.2 Marine
- 5.2.3 Aerospace
- 5.2.4 Heavy Equipment
- 5.2.4.1 Construction
- 5.2.4.2 Mining
- 5.2.4.3 Agriculture
- 5.2.5 Industrial
- 5.2.5.1 Power Generation
- 5.2.5.2 Metallurgy and Metalworking
- 5.2.5.3 Textiles
- 5.2.5.4 Oil and Gas
- 5.2.5.5 Other End-Use Industries
- 5.2.1 Automotive
- 5.3 By Base Stock Type
- 5.3.1 Mineral Oil-Based Lubricants
- 5.3.2 Synthetic Lubricants
- 5.3.3 Semi-Synthetic Lubricants
- 5.3.4 Bio-Based Lubricants
6 Competitive Landscape
- 6.1 Market Concentration
- 6.2 Strategic Moves
- 6.3 Market Share (%)/Ranking Analysis
- 6.4 Company Profiles (includes Global level Overview, Market level overview, Core Segments, Financials as available, Strategic Information, Market Rank/Share, Products and Services, Recent Developments)
- 6.4.1 AMSOIL INC.
- 6.4.2 BP p.l.c
- 6.4.3 Calumet Inc.
- 6.4.4 Chevron Corporation
- 6.4.5 CITGO Petroleum Lubricants
- 6.4.6 Exxon Mobil Corporation
- 6.4.7 FUCHS
- 6.4.8 Gulf Oil International
- 6.4.9 HF Sinclair Corporation
- 6.4.10 Idemitsu Lubricants America
- 6.4.11 Lucas Oil Products Inc.
- 6.4.12 Motul USA
- 6.4.13 Penzoil
- 6.4.14 Phillips 66 Company
- 6.4.15 Quaker Chemical Corporation
- 6.4.16 Renewable Lubricants Inc.
- 6.4.17 Saudi Arabian Co. Ltd
- 6.4.18 Shell plc
- 6.4.19 TotalEnergies
7 Market Opportunities and Future Outlook
- 7.1 White-space and Unmet-Need Assessment
8 Key Strategic Questions for CEOs

