
PUBLISHER: Mordor Intelligence | PRODUCT CODE: 1937390

PUBLISHER: Mordor Intelligence | PRODUCT CODE: 1937390
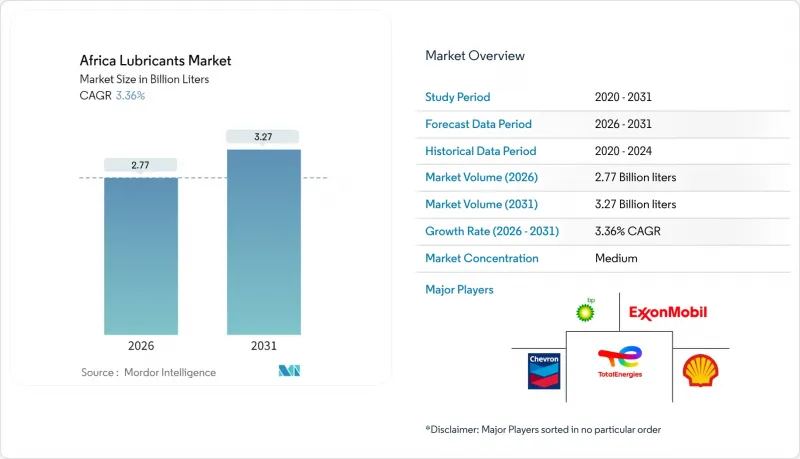
Africa Lubricants - Market Share Analysis, Industry Trends & Statistics, Growth Forecasts (2026 - 2031)
The Africa Lubricants Market is expected to grow from 2.68 billion liters in 2025 to 2.77 billion liters in 2026 and is forecast to reach 3.27 billion liters by 2031 at 3.36% CAGR over 2026-2031.
Robust infrastructure programs, accelerating mining output, and the rapid expansion of regional vehicle fleets underpin this volume growth. Public and private investments in road, rail, and energy assets continue to drive higher demand for construction machinery lubricants, while rising motorization rates in cities, from Cairo to Lagos, support sustained consumption of automotive engine oils. Local refinery upgrades, notably the base-oil streams emerging from new Nigerian capacity, strengthen regional supply resilience and temper import dependence. OEM mandates for extended drain intervals are nudging buyers toward synthetic grades, especially in markets now enforcing Euro 4 and Euro 5 emission norms, and this transition is most evident in Egypt, South Africa, and Morocco. Competitive intensity remains moderate; international majors leverage brand equity and technical know-how, yet regionally rooted suppliers gain ground by offering flexible pack sizes, price-competitive mineral formulations, and on-site equipment services.
Africa Lubricants Market Trends and Insights
Rapid Motorization Driving Automotive Lubricant Demand
Vehicle ownership is rising faster than population growth in major urban centers, creating a steady pull for engine oils, transmission fluids, and brake fluids. Commercial truck fleets in Lagos and Johannesburg experience arduous duty cycles, which shorten oil change intervals and increase consumption. National assembly plants across North Africa now require factory-fill volumes and consistent aftermarket supply, with local content regulations encouraging in-country blending. Motorists are gradually shifting from monograde to multigrade formulations as modern engines become more prevalent, and the preference for smaller pack sizes aligns with the purchasing power of individual car owners. OEM service networks champion licensed products that meet Euro 5 emission requirements, thereby accelerating the uptake of mid-SAPs synthetic blends.
Infrastructure-Led Mining and Construction Boom
Copper, phosphate, and critical mineral projects are expanding in South Africa, Zambia, and Morocco, each utilizing heavy mechanical loaders and conveyors that require premium hydraulic fluids and EP gear oils capable of withstanding dust and high loads. Concurrent road, port, and rail upgrades across Egypt and Nigeria sustain demand for greases and turbine oils used in large earth-moving equipment and power generation sets. Suppliers able to deliver bulk volumes to remote sites win contracts, while those offering oil analysis and condition monitoring services secure long-term relationships that lock in product offtake. The predictable operating schedules of construction consortia create baseline orders that stabilize blender capacity utilization even during seasonal dips in passenger car consumption.
Persistent Fuel-Subsidy Volatility Distorting Prices
Abrupt subsidy removals or reinstatements shift pump prices and indirectly influence lubricant demand, as transporters recalibrate mileage and maintenance budgets. Sudden cost spikes prompt operators to stretch drain intervals or down-trade to cheaper monograde oils, eroding premium segment volumes. Importers struggle to forecast landed costs when exchange rates and subsidy levels change in tandem, complicating inventory decisions. Policy uncertainty discourages heavy capital investment in blending plants and storage, prolonging reliance on toll blending and third-party logistics.
Other drivers and restraints analyzed in the detailed report include:
- Local Refinery Upgrades Boosting Base-Oil Availability
- OEM Drain-Interval Extensions Favoring Synthetics
- Dominance of Low-Grade Group I Imports
For complete list of drivers and restraints, kindly check the Table Of Contents.
Segment Analysis
Automotive engine oil held 36.05% of Africa's lubricants market share in 2025, supported by a continent-wide vehicle fleet that continues to age under challenging operating conditions. Commercial trucks account for a sizable portion of sump volumes, and frequent oil changes increase the total liters consumed each year. Process oils, serving rubber, textile, and petrochemical plants, are forecast to grow at a 4.25% CAGR, the fastest among all product lines, thanks to industrial diversification programs in Egypt and Nigeria. Gear oils cater to underground mining machines that operate under extreme shock loads, while transmission fluids gain prominence as automatic gearboxes become more prevalent in commercial fleets. Hydraulic fluids experience steady demand from backhoes and cranes operating on large construction sites throughout West and North Africa. Metalworking fluids track the evolution of domestic component manufacturing, particularly the brake pad and filter plants that have recently been established in Morocco.
Demand for greases is rising in surface mining and marine thrusters, with lithium-complex products preferred for their water resistance. Brake fluids show linear growth in line with new vehicle assemblies, though the shift toward electric cars may curb long-term expansion. Turbine oils secure slots in combined-cycle gas plants commissioned under national electrification agendas, and transformer oils benefit from grid reinforcement projects feeding rapidly urbanizing regions. Collectively, the diversified product slate anchors the resilience of the Africa lubricants market, balancing cyclical softness in any single end-use with momentum in others.
The Africa Lubricants Market Report is Segmented by Product Type (Automotive Engine Oil, Industrial Engine Oil, and More), End-User Industry (Automotive, Marine, Aerospace, Heavy Equipment, and Industrial), Base Stock Type (Mineral Oil-Based, Synthetic, Semi-Synthetic, and Bio-Based), and Geography (Nigeria, South Africa, Egypt, Algeria, Morocco, and Rest of Africa). The Market Forecasts are Provided in Terms of Volume (Liters).
List of Companies Covered in this Report:
- Ardova Plc
- BP plc
- Chevron Corporation
- CONOIL GROUP PTY LTD.
- Engen Petroleum (PTY) LTD
- Exxon Mobil Corporation
- FUCHS
- Misr Petroleum
- MRS OIL NIGERIA PLC
- Oando PLC
- Sasol
- Shell plc
- TotalEnergies
- Vivo Energy Holding B.V.
Additional Benefits:
- The market estimate (ME) sheet in Excel format
- 3 months of analyst support
TABLE OF CONTENTS
1 Introduction
- 1.1 Study Assumptions and Market Definition
- 1.2 Scope of the Study
2 Research Methodology
3 Executive Summary
4 Market Landscape
- 4.1 Market Overview
- 4.2 Market Drivers
- 4.2.1 Rapid motorisation driving automotive lubricant demand
- 4.2.2 Infrastructure-led mining and construction boom
- 4.2.3 Local refinery upgrades boosting base-oil availability
- 4.2.4 OEM drain-interval extensions favouring synthetics
- 4.2.5 Fast-growing e-commerce fleet requiring high-performance fluids
- 4.3 Market Restraints
- 4.3.1 Persistent fuel-subsidy volatility distorting prices
- 4.3.2 Dominance of low-grade Group I imports
- 4.3.3 Informal counterfeit-oil networks eroding brand value
- 4.4 Value Chain Analysis
- 4.5 Regulatory Framework
- 4.6 End-User Trends
- 4.6.1 Automotive Industry
- 4.6.2 Manufacturing Industry
- 4.6.3 Power Generation Industry
- 4.7 Porter's Five Forces
- 4.7.1 Bargaining Power of Suppliers
- 4.7.2 Bargaining Power of Buyers
- 4.7.3 Threat of New Entrants
- 4.7.4 Threat of Substitutes
- 4.7.5 Degree of Competition
5 Market Size and Growth Forecasts (Volume)
- 5.1 By Product Type
- 5.1.1 Automotive Engine Oil
- 5.1.2 Industrial Engine Oil
- 5.1.3 Transmission Fluids
- 5.1.4 Gear Oil
- 5.1.5 Brake Fluids
- 5.1.6 Hydraulic Fluids
- 5.1.7 Greases
- 5.1.8 Process Oil (Including Rubber Process Oil and White Oil)
- 5.1.9 Metalworking Fluids
- 5.1.10 Turbine Oil
- 5.1.11 Transformer Oil
- 5.1.12 Other Product Types
- 5.2 By End-user Industry
- 5.2.1 Automotive
- 5.2.1.1 Passenger Vehicles
- 5.2.1.2 Commercial Vehicles
- 5.2.1.3 Two-Wheelers
- 5.2.2 Marine
- 5.2.3 Aerospace
- 5.2.4 Heavy Equipment
- 5.2.4.1 Construction
- 5.2.4.2 Mining
- 5.2.4.3 Agriculture
- 5.2.5 Industrial
- 5.2.5.1 Power Generation
- 5.2.5.2 Metallurgy and Metalworking
- 5.2.5.3 Textiles
- 5.2.5.4 Oil and Gas
- 5.2.5.5 Other End-Use Industries
- 5.2.1 Automotive
- 5.3 By Base Stock Type
- 5.3.1 Mineral Oil-Based Lubricants
- 5.3.2 Synthetic Lubricants
- 5.3.3 Semi-Synthetic Lubricants
- 5.3.4 Bio-Based Lubricants
- 5.4 By Geography
- 5.4.1 Nigeria
- 5.4.2 South Africa
- 5.4.3 Egypt
- 5.4.4 Algeria
- 5.4.5 Morocco
- 5.4.6 Rest of Africa
6 Competitive Landscape
- 6.1 Market Concentration
- 6.2 Strategic Moves
- 6.3 Market Share (%)/Ranking Analysis
- 6.4 Company Profiles (includes Global-level Overview, Market-level Overview, Core Segments, Financials, Strategic Information, Market Rank/Share, Products and Services, Recent Developments)
- 6.4.1 Ardova Plc
- 6.4.2 BP plc
- 6.4.3 Chevron Corporation
- 6.4.4 CONOIL GROUP PTY LTD.
- 6.4.5 Engen Petroleum (PTY) LTD
- 6.4.6 Exxon Mobil Corporation
- 6.4.7 FUCHS
- 6.4.8 Misr Petroleum
- 6.4.9 MRS OIL NIGERIA PLC
- 6.4.10 Oando PLC
- 6.4.11 Sasol
- 6.4.12 Shell plc
- 6.4.13 TotalEnergies
- 6.4.14 Vivo Energy Holding B.V.
7 Market Opportunities and Future Outlook
- 7.1 White-space and Unmet-need Assessment
8 Key Strategic Questions for CEOs

