
PUBLISHER: Mordor Intelligence | PRODUCT CODE: 1940764

PUBLISHER: Mordor Intelligence | PRODUCT CODE: 1940764
United States Road Freight Transport - Market Share Analysis, Industry Trends & Statistics, Growth Forecasts (2026 - 2031)
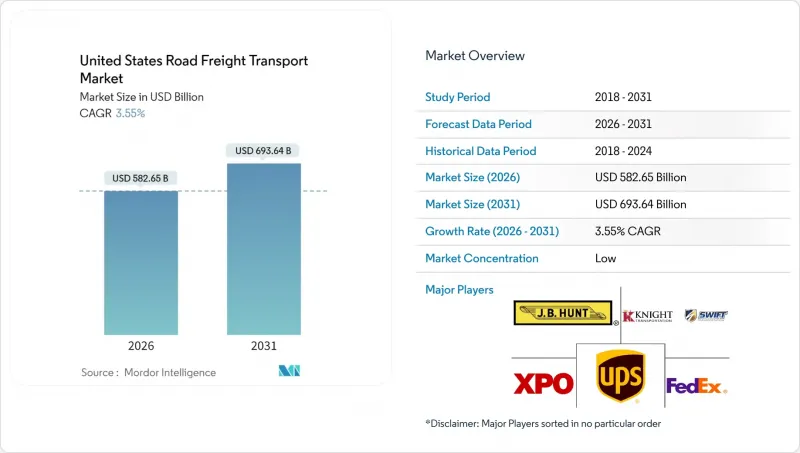
The United States road freight transport market size in 2026 is estimated at USD 582.65 billion, growing from 2025 value of USD 562.68 billion with 2031 projections showing USD 693.64 billion, growing at 3.55% CAGR over 2026-2031.
This momentum reflects a resilient freight ecosystem that absorbs federal infrastructure spending, manufacturing reshoring programs, and e-commerce fulfillment growth. Dedicated truck lanes funded by the Infrastructure Investment and Jobs Act (IIJA) are shortening peak-hour transit times and improving equipment utilization. Supply chain realignment under the CHIPS and Science Act is pulling semiconductor and life-sciences traffic onto highways, while dynamic-pricing APIs in the LTL segment are unlocking latent capacity. Digital freight matching platforms now steer a rising share of total loads, tightening pickup windows and smoothing seasonal rate swings. Widespread driver shortages and diesel price volatility remain structural headwinds that encourage automation pilots, alternative-fuel tractors, and strategic fleet expansions.
United States Road Freight Transport Market Trends and Insights
E-Commerce Fulfillment Pressure Drives Expedited Capacity Demand
Same-day and next-day delivery benchmarks push carriers to cycle assets faster and slash empty miles. Amazon exceeded 1,000 U.S. fulfillment centers in 2024, concentrating outbound volumes and trimming metro-area dead-head by up to 12%. Expedited freight already supplies 23% of trucking revenue, mirroring retailers' preference for speed over purely cost-based routing. High-velocity parcel traffic fuels hub-and-spoke densification, fleet telematics upgrades, and trailer pool expansions. Carriers that integrate parcel APIs with truckload networks report narrower pickup windows and improved on-time performance metrics.
Supply Chain Reshoring Accelerates Domestic Freight Volumes
The CHIPS and Science Act's USD 52 billion incentive package is anchoring semiconductor fabs in Arizona, Ohio, and Texas. Intel and TSMC projects require heavy-haul moves for lithography tools that can weigh more than 180 metric tons, creating premium flatbed demand. Life-sciences reshoring lifts temperature-controlled freight; pharmaceutical truck-loadings are rising 15% annually as domestic fill-finish sites multiply. Specialized carriers benefit from validated cold-chain trailers and real-time temperature telemetry that meets Good Distribution Practice standards.
Driver Shortage Crisis Intensifies Amid Regulatory Pressures
The United States needed 78,000 additional long-haul drivers in 2024, and California's AB-5 employment classification amplified capacity removal by 15% within the state. Proposed copycat legislation in New York and Illinois risks spreading compliance expenses nationwide. FMCSA drug-and-alcohol clearinghouse rules disqualified 2.3% of CDL holders during 2024, further tightening the labor pool. Carriers respond with signing bonuses, accelerated training programs, and driver-assistance technologies aimed at lowering fatigue.
Other drivers and restraints analyzed in the detailed report include:
- Federal Infrastructure Investment Expands Freight Corridor Capacity
- Dynamic-Pricing APIs Transform the LTL Market Structure
- Diesel Price Volatility Creates Operational Margin Pressure
For complete list of drivers and restraints, kindly check the Table Of Contents.
Segment Analysis
Manufacturing generated 31.12% of United States road freight transport market revenue in 2025, underpinned by industrial reshoring and sustained automotive, machinery, and electronics output. The United States road freight transport market size tied to manufacturing will expand steadily as capital-intensive fabs and assembly plants require synchronized inbound and outbound logistics. Wholesale and retail trade, buoyed by e-commerce restocking cycles, is the fastest-growing vertical, advancing at a 4.05% CAGR between 2026-2031. LTL networks with dense metro terminals capture incremental volumes from omnichannel retailers who value flexible pickup cutoffs. Construction freight rides the IIJA-funded project wave, demanding bulk aggregate hauls and oversize concrete girder moves. Agriculture continues to show seasonal peaks; harvest-period spikes often strain trailer availability and push spot rates upward.
Department of Transportation hours-of-service rules create planning complexity for long agricultural and manufacturing lanes, but telematics-driven routing software mitigates downtime. Renewable-energy components and data-center equipment are emerging sub-segments. Flatbed carriers hauling wind-turbine blades and hyperscale server racks earn premium yields thanks to escort-vehicle requirements and specialized tarping. Compliance with electronic logging devices (ELDs) and safety-score benchmarks remains essential for shippers that enforce strict carrier-selection protocols.
Domestic freight held 62.10% of the United States road freight transport market in 2025 as reshoring limited trans-oceanic reliance. Nonetheless, international lanes mainly Mexico-bound are projected to grow 4.10% CAGR between 2026 and 2031. USMCA rule-of-origin incentives boost northbound auto-parts and southbound machinery volumes, while the Customs and Border Protection's ACE system has cut commercial border crossing times by one-quarter. Carriers operating international lanes must maintain bilingual drivers, maintain C-TPAT certifications, and manage peso-denominated back-haul pricing. Domestic traffic gains from reduced port congestion, but cross-border specialists command margin premiums for navigating dual inspections and cabotage constraints.
International operations also rely heavily on insurance riders to meet Mexican liability frameworks and deploy satellite-based trailer tracking to deter cargo theft in high-risk corridors. The segment is gaining additional traction as near-shoring plants in Monterrey and Chihuahua import U.S. raw materials and export high-value consumer durables.
Full-truck-load commands nearly four-fifths of all shipments, but the 3.98% CAGR between 2026-2031 anticipated in LTL outpaces the broader United States road freight transport market through 2031. Density-priced pallets, parcel spillover, and returns processing feed LTL terminal volumes. Investments in robotic cross-docks, handheld scanners, and real-time API quoting compress dwell times and raise turns per trailer. FTL still dominates heavy industrial lanes that demand whole-trailer cubic capacity; however, driver scarcity and uncertain diesel costs are raising dedicated-contract rates.
LTL carriers are piloting double-44-ft pup combinations in select states to elevate cubic efficiency within statutory gross-vehicle-weight ceilings. FTL fleets, by contrast, are expanding drop-and-hook programs to mitigate parking shortages and ELD-mandated rest breaks. Insurance minimums under 49 CFR 387 remain higher for LTL given terminal exposure, encouraging carriers to pursue cargo-damage-reduction analytics.
The United States Road Freight Transport Market Report is Segmented by End User Industry (Manufacturing, and More), Destination (Domestic and International), Truckload Specification (FTL and LTL), Distance (Long Haul and Short Haul), Goods Configuration (Fluid Goods and Solid Goods), Temperature Control (Non-Temperature and Temperature Controlled), and by Containerization. The Market Forecasts are Provided in Terms of Value (USD).
List of Companies Covered in this Report:
- ArcBest
- Averitt Express, Inc.
- C.H. Robinson
- DHL Group
- Estes Express Lines
- FedEx
- J.B. Hunt Transport, Inc.
- Knight-Swift Transportation
- Landstar System, Inc.
- Old Dominion Freight Line
- Penske Logistics, Inc.
- R+L Carriers
- Ryder System, Inc.
- Saia Inc.
- Schneider National, Inc.
- Southeastern Freight Lines
- Total Quality Logistics, LLC
- United Parcel Service of America, Inc. (UPS)
- Werner Enterprises, Inc.
- XPO, Inc.
Additional Benefits:
- The market estimate (ME) sheet in Excel format
- 3 months of analyst support
TABLE OF CONTENTS
1 Introduction
- 1.1 Study Assumptions and Market Definition
- 1.2 Scope of the Study
2 Research Methodology
3 Executive Summary
4 Market Landscape
- 4.1 Market Overview
- 4.2 GDP Distribution by Economic Activity
- 4.3 GDP Growth by Economic Activity
- 4.4 Economic Performance and Profile
- 4.4.1 Trends in E-Commerce Industry
- 4.4.2 Trends in Manufacturing Industry
- 4.5 Transport and Storage Sector GDP
- 4.6 Logistics Performance
- 4.7 Length of Roads
- 4.8 Export Trends
- 4.9 Import Trends
- 4.10 Fuel Pricing Trends
- 4.11 Trucking Operational Costs
- 4.12 Trucking Fleet Size by Type
- 4.13 Major Truck Suppliers
- 4.14 Road Freight Tonnage Trends
- 4.15 Road Freight Pricing Trends
- 4.16 Modal Share
- 4.17 Inflation
- 4.18 Regulatory Framework
- 4.19 Value Chain and Distribution Channel Analysis
- 4.20 Market Drivers
- 4.20.1 E-Commerce Fulfillment Pressure on Expedited Trucking Capacity
- 4.20.2 On-Shoring of Critical United States Supply Chains (Semiconductors, Life-Sciences)
- 4.20.3 Federal Funding Surge for Highway Infrastructure (IIJA 2021-2026)
- 4.20.4 Wide-Scale Roll-Out of LTL Dynamic-Pricing APIs by Top Carriers
- 4.20.5 State-Led Autonomous and Truck-Only Toll-Lane Pilots (TX, GA) Opening Dedicated Freight Capacity
- 4.20.6 Start-Up Consolidation Driving Digital-Broker Penetration >25 % Loads By 2030
- 4.21 Market Restraints
- 4.21.1 Acute Long-Haul Driver Shortage and AB-5 Style State Legislation
- 4.21.2 Freight-Rate Volatility Linked to Diesel Price Swings
- 4.21.3 Truck OEM Production Bottlenecks (Semiconductor and DEF Sensors)
- 4.21.4 Bridge-and-Tunnel Toll Inflation Outpacing CPI in Urban Corridors
- 4.22 Technology Innovations in the Market
- 4.23 Porter's Five Forces Analysis
- 4.23.1 Threat of New Entrants
- 4.23.2 Bargaining Power of Buyers
- 4.23.3 Bargaining Power of Suppliers
- 4.23.4 Threat of Substitutes
- 4.23.5 Competitive Rivalry
5 Market Size and Growth Forecasts (Value, USD)
- 5.1 End User Industry
- 5.1.1 Agriculture, Fishing, and Forestry
- 5.1.2 Construction
- 5.1.3 Manufacturing
- 5.1.4 Oil and Gas, Mining and Quarrying
- 5.1.5 Wholesale and Retail Trade
- 5.1.6 Others
- 5.2 Destination
- 5.2.1 Domestic
- 5.2.2 International
- 5.3 Truckload Specification
- 5.3.1 Full-Truck-Load (FTL)
- 5.3.2 Less than-Truck-Load (LTL)
- 5.4 Containerization
- 5.4.1 Containerized
- 5.4.2 Non-Containerized
- 5.5 Distance
- 5.5.1 Long Haul
- 5.5.2 Short Haul
- 5.6 Goods Configuration
- 5.6.1 Fluid Goods
- 5.6.2 Solid Goods
- 5.7 Temperature Control
- 5.7.1 Non-Temperature Controlled
- 5.7.2 Temperature Controlled
6 Competitive Landscape
- 6.1 Market Concentration
- 6.2 Key Strategic Moves
- 6.3 Market Share Analysis
- 6.4 Company Profiles (Includes Global Level Overview, Market Level Overview, Core Segments, Financials as Available, Strategic Information, Market Rank/Share for Key Companies, Products and Services, and Recent Developments)
- 6.4.1 ArcBest
- 6.4.2 Averitt Express, Inc.
- 6.4.3 C.H. Robinson
- 6.4.4 DHL Group
- 6.4.5 Estes Express Lines
- 6.4.6 FedEx
- 6.4.7 J.B. Hunt Transport, Inc.
- 6.4.8 Knight-Swift Transportation
- 6.4.9 Landstar System, Inc.
- 6.4.10 Old Dominion Freight Line
- 6.4.11 Penske Logistics, Inc.
- 6.4.12 R+L Carriers
- 6.4.13 Ryder System, Inc.
- 6.4.14 Saia Inc.
- 6.4.15 Schneider National, Inc.
- 6.4.16 Southeastern Freight Lines
- 6.4.17 Total Quality Logistics, LLC
- 6.4.18 United Parcel Service of America, Inc. (UPS)
- 6.4.19 Werner Enterprises, Inc.
- 6.4.20 XPO, Inc.
7 Market Opportunities and Future Outlook
- 7.1 White-space and Unmet-Need Assessment

