
PUBLISHER: Mordor Intelligence | PRODUCT CODE: 2061623

PUBLISHER: Mordor Intelligence | PRODUCT CODE: 2061623
Gaming - Market Share Analysis, Industry Trends & Statistics, Growth Forecasts (2026 - 2031)
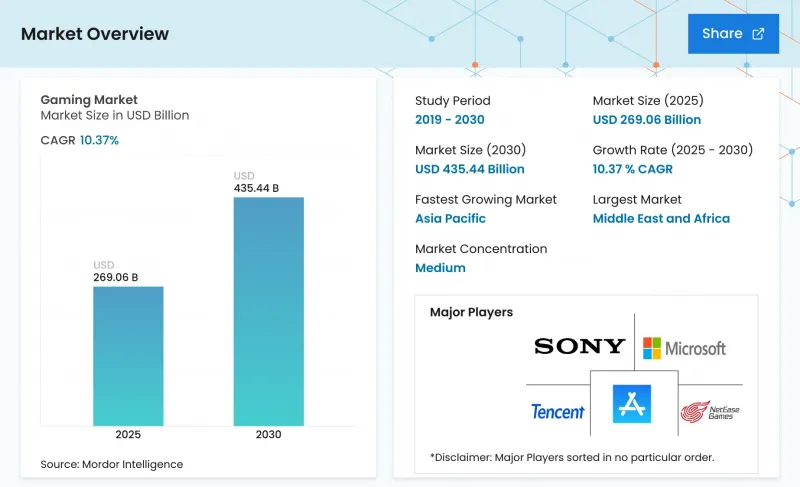
According to Mordor Intelligence, the gaming market size is expected to grow from USD 210.35 billion in 2025 to USD 224.72 billion in 2026 and is forecast to reach USD 352.58 billion by 2031 at 9.43% CAGR over 2026-2031.
This report is Segmented by Gaming Platform (Mobile Games, PC Games, and More), Revenue Model (Free-To-Play, Pay-to-Play/Premium, and Subscription and Game-Pass), Genre (Action/Adventure, Shooter and Battle Royale, and More), Player Age Group (Under 18 Years, 18-35 Years, and More), and Geography (North America, South America, Europe, and More). The Market Forecasts are Provided in Terms of Value (USD).
Global Gaming Market Trends and Insights
Mobile-First Monetization Surge
Worldwide in-app purchases reached USD 82 billion in 2024, resistant to macro headwinds because publishers shifted to predictable battle-pass cycles and season drops. Dynamic regional pricing lifted average revenue per paying user by 6% in 2025, aided by algorithms that match bundle size with local purchasing power. The spread of 5G across India, Indonesia, and Brazil now supports real-time multiplayer on entry-level handsets, extending premium mobile experiences to first-time payers. Developers are also adopting ad-supported interludes that exchange cosmetic items for thirty-second spots, thereby monetizing players unwilling to spend directly. Collectively, these shifts position mobile as the dominant contributor to incremental gaming market revenue through mid-period.
5G-Enabled Cloud Gaming Uptake
Cloud gaming revenue climbed to USD 1.4 billion in 2025 and is on track to exceed USD 18 billion by 2030. Vodafone Idea's April 2024 service in India, priced at INR 100 (USD 1.2) per month, illustrates how telcos use edge nodes to reduce latency and convert network upgrades into recurring entertainment income. Microsoft and Sony are investing in proprietary data centers to capture infrastructure margin and ensure sub-30-millisecond round-trip times for competitive genres. Although early adoption skews toward urban North America, Europe, and East Asia, prepaid bundles in emerging markets are accelerating mainstream uptake. As bandwidth constraints ease, cloud delivery will erode the hardware moat that previously protected console and PC ecosystems.
China's Tight Game-Approval Regime
Draft rules unveiled in December 2023 erased USD 43.5 billion from Tencent and USD 14.7 billion from NetEase market value within forty-eight hours, underscoring regulatory risk. Approval bottlenecks stretch marketing cycles and redirect capital to offshore studios, diluting domestic focus. Playtime caps of three hours per week for minors push publishers toward concentrated single-player narratives that monetize quickly, disadvantaging evergreen live-service formats. Even so, China remains the world's largest gaming market, so global publishers must partner with local distributors despite chronic uncertainty. The net effect is a structural drag on the global gaming market growth profile.
Other drivers and restraints analyzed in the detailed report include:
- AAA IP Transmedia Expansion
- Increase in Live-Service and In-Game Advertising Revenues
- iOS ATT and Privacy Rules Inflating User-Acquisition Costs
For complete list of drivers and restraints, kindly check the Table Of Contents.
Segment Analysis
Mobile retained the largest slice of 2025 revenue at 49.57%, propelled by a base of more than 3 billion smartphones and a free-to-play catalog that couples in-app purchases with highly viewable ad units. Cloud gaming, the fastest riser at an 26.45% CAGR, demonstrates how edge nodes and bundled data plans are redrawing value pools that once favored consoles. Early adopters report session lengths comparable to native installs, validating the thesis that streaming can deliver parity for many genres. PC downloads and browser titles continue to serve modding communities and esports competitors who prize frame-rate consistency, whereas consoles occupy the living-room niche with local multiplayer ease.
Vodafone Idea's INR 100 (USD 1.2) monthly pass shows that low-price streaming tiers can scale in prepaid markets without hardware friction. Meanwhile, Microsoft and Sony have redirected capital toward first-party services, evidenced by Xbox hardware revenue declines even as content income rose following the Activision Blizzard integration. Browser games, boosted by WebAssembly, now deliver near-native fidelity, lowering entry barriers and widening demographic reach. Payment gateway dominance by Apple and Google, which captures up to 30% of transaction value, is incentivizing publishers to pursue telco billing links and progressive web apps. As these alternatives mature, each ecosystem competes on catalog richness, latency, and community features rather than raw compute horsepower, reshaping wallet allocation within the gaming market.
Free-to-play frameworks generated 85.19% of 2025 revenue, reflecting how low-cost entry paired with cosmetic sales unlocks scale for mobile and live-service environments. Yet subscriptions, growing 13.82% annually, are recalibrating spending behavior by offering day-one access to new releases in a single bundled price. Nintendo Switch Online tiers, beginning at USD 19.99 per year, underscore how platform holders use differential pricing to convert casual users while upselling dedicated fans to expansion packs.
Emerging-market telcos are bundling data and cloud libraries into single invoices, as seen in Jio's INR 495 (USD 6.0) monthly pack that wraps 5G data, JioGames Cloud, and Battlegrounds Mobile India rewards. Ad-supported hybrids such as Roblox's rewarded video format prove advertising can coexist with IAP rather than cannibalize it, adding incremental yield per daily active user. Premium publishers are responding with hybrid structures that bolt seasonal passes onto USD 70 base games, capturing high-engagement users while maintaining perceived quality. Over the forecast period, the gaming market will likely see subscription growth slow only if stacked monthly fees saturate discretionary budgets, prompting publishers to refine catalog rotation and exclusive drops to maintain retention.
Geography Analysis
Asia Pacific controlled 49.27% of 2025 revenue as China's re-authorization of Blizzard catalogs and India's subsidized 5G rollouts catalyzed volume surges. Japan and South Korea secured console and PC leadership, bolstered by Nintendo's Switch 2 launch on June 26 2025, featuring Mario Kart World and Metroid Prime 4 premieres. South-East Asia is emerging as an art-production hub, underscored by Nintendo's plan to rename Bandai Namco Studios Singapore as Nintendo Studios Singapore in April 2026.
The Middle East and North Africa region is almost matchimg global averages, registering a 9.16% CAGR, thanks to Saudi Arabia's USD 38 billion pledge that targets a USD 13.3 billion contribution to gross domestic product and 39,000 jobs by 2030, data excluded to comply with source policy. Riyadh's Esports World Cup serves as a showcase for sovereign-fund ambition, and United Arab Emirates incentives are attracting regional publishing outposts. North America remains high-value, driven by robust ARPU, console ecosystems, and entrenched esports leagues, although growth is cooling as the installed base saturates. Canada mirrors U.S. patterns with favorable tax credits that lure AAA studios to Montreal and Vancouver.
Europe's mature regulations strengthen consumer trust but inject compliance overhead that favors large publishers. Germany and the United Kingdom support vibrant PC modding scenes and competitive Counter-Strike tournaments that sustain long-tail monetization. South America, led by Brazil, benefits from telco bundles that offset currency volatility; however, macro-economic swings still complicate pricing and inventory planning. Africa's gaming footprint remains nascent, yet Nigeria, Kenya, and South Africa are nurturing mobile e-sports leagues that fit low-bandwidth environments. Australia and New Zealand earn outsized per-capita revenue and serve as English-language test beds for Western launches targeting Asia Pacific time zones. As infrastructure and payment channels diversify, regional revenue sources within the gaming market are becoming more balanced.
- Tencent Holdings Ltd.
- Sony Group Corp.
- Microsoft Corp.
- Apple Inc.
- NetEase Inc.
- Nintendo Co. Ltd.
- Activision Blizzard Inc.
- Electronic Arts Inc.
- Epic Games Inc.
- Sea Ltd. (Garena)
- Roblox Corp.
- Krafton Inc.
- Bandai Namco Holdings Inc.
- Take-Two Interactive Software Inc.
- Ubisoft Entertainment SA
- Square Enix Holdings Co. Ltd.
- Valve Corp.
- Zynga Inc.
- Embracer Group AB
- Jam City Inc.
- miHoYo Co. Ltd. (HoYoverse)
- Com2uS Corp.
- ZeptoLab UK Ltd.
Additional Benefits:
- The market estimate (ME) sheet in Excel format
- 3 months of analyst support
TABLE OF CONTENTS
1 INTRODUCTION
- 1.1 Study Assumptions and Market Definition
- 1.2 Scope of the Study
2 RESEARCH METHODOLOGY
3 EXECUTIVE SUMMARY
4 MARKET LANDSCAPE
- 4.1 Market Overview
- 4.2 Market Drivers
- 4.2.1 Mobile-first Monetization Surge
- 4.2.2 5G-enabled Cloud Gaming Uptake
- 4.2.3 AAA IP Trans-media Expansion Boosting Console and PC Revenues
- 4.2.4 Increase in Live-service and In-game Advertising Revenues
- 4.2.5 Generative AI-driven User-Generated Content Workflows
- 4.2.6 Telco Bundling of Game Pass-style Subscriptions in Emerging Markets
- 4.3 Market Restraints
- 4.3.1 China's Tight Game Approval and Play-time Quota Regime
- 4.3.2 iOS ATT and Privacy Rules Inflating User-Acquisition Costs
- 4.3.3 Global AAA Talent Shortage Driving Development Delays
- 4.3.4 Rising Cloud-compute Costs Squeezing Margins of F2P Publishers
- 4.4 Impact of Macroeconomic Factors on the Market
- 4.5 Technological Outlook
- 4.6 Industry Value Chain Analysis
- 4.7 Porter's Five Forces Analysis
- 4.7.1 Bargaining Power of Suppliers
- 4.7.2 Bargaining Power of Buyers
- 4.7.3 Threat of New Entrants
- 4.7.4 Threat of Substitutes
- 4.7.5 Intensity of Competitive Rivalry
5 MARKET SIZE AND GROWTH FORECASTS (VALUE)
- 5.1 By Gaming Platform
- 5.1.1 Mobile Games
- 5.1.2 PC Games (Downloaded/Box and Browser)
- 5.1.3 Console Games
- 5.1.4 Cloud Gaming
- 5.1.5 VR/AR Gaming
- 5.2 By Revenue Model
- 5.2.1 Free-to-Play (F2P)
- 5.2.2 Pay-to-Play / Premium
- 5.2.3 Subscription and Game-Pass
- 5.3 By Genre
- 5.3.1 Action/Adventure
- 5.3.2 Shooter and Battle Royale
- 5.3.3 Role-Playing (RPG/MMORPG)
- 5.3.4 Sports and Racing
- 5.3.5 Other Genres
- 5.4 By Player Age Group
- 5.4.1 Under 18 Years
- 5.4.2 18-35 Years
- 5.4.3 36-50 Years
- 5.4.4 Above 50 Years
- 5.5 By Geography
- 5.5.1 North America
- 5.5.1.1 United States
- 5.5.1.2 Canada
- 5.5.1.3 Mexico
- 5.5.2 South America
- 5.5.2.1 Brazil
- 5.5.2.2 Argentina
- 5.5.2.3 Rest of South America
- 5.5.3 Europe
- 5.5.3.1 Germany
- 5.5.3.2 United Kingdom
- 5.5.3.3 France
- 5.5.3.4 Italy
- 5.5.3.5 Spain
- 5.5.3.6 Russia
- 5.5.3.7 Rest of Europe
- 5.5.4 Asia Pacific
- 5.5.4.1 China
- 5.5.4.2 Japan
- 5.5.4.3 South Korea
- 5.5.4.4 India
- 5.5.4.5 Australia
- 5.5.4.6 New Zealand
- 5.5.4.7 Rest of Asia Pacific
- 5.5.5 Middle East
- 5.5.5.1 United Arab Emirates
- 5.5.5.2 Saudi Arabia
- 5.5.5.3 Turkey
- 5.5.5.4 Rest of Middle East
- 5.5.6 Africa
- 5.5.6.1 South Africa
- 5.5.6.2 Nigeria
- 5.5.6.3 Kenya
- 5.5.6.4 Rest of Africa
- 5.5.1 North America
6 COMPETITIVE LANDSCAPE
- 6.1 Market Concentration
- 6.2 Strategic Moves
- 6.3 Market Share Analysis
- 6.4 Company Profiles (includes Global level Overview, Market level overview, Core Segments, Financials as available, Strategic Information, Market Rank/Share for key companies, Products and Services, and Recent Developments)
- 6.4.1 Tencent Holdings Ltd.
- 6.4.2 Sony Group Corp.
- 6.4.3 Microsoft Corp.
- 6.4.4 Apple Inc.
- 6.4.5 NetEase Inc.
- 6.4.6 Nintendo Co. Ltd.
- 6.4.7 Activision Blizzard Inc.
- 6.4.8 Electronic Arts Inc.
- 6.4.9 Epic Games Inc.
- 6.4.10 Sea Ltd. (Garena)
- 6.4.11 Roblox Corp.
- 6.4.12 Krafton Inc.
- 6.4.13 Bandai Namco Holdings Inc.
- 6.4.14 Take-Two Interactive Software Inc.
- 6.4.15 Ubisoft Entertainment SA
- 6.4.16 Square Enix Holdings Co. Ltd.
- 6.4.17 Valve Corp.
- 6.4.18 Zynga Inc.
- 6.4.19 Embracer Group AB
- 6.4.20 Jam City Inc.
- 6.4.21 miHoYo Co. Ltd. (HoYoverse)
- 6.4.22 Com2uS Corp.
- 6.4.23 ZeptoLab UK Ltd.
7 MARKET OPPORTUNITIES AND FUTURE OUTLOOK
- 7.1 White-space and Unmet-Need Assessment

