
PUBLISHER: Mordor Intelligence | PRODUCT CODE: 2065763

PUBLISHER: Mordor Intelligence | PRODUCT CODE: 2065763
Web3 - Market Share Analysis, Industry Trends & Statistics, Growth Forecasts (2026 - 2031)
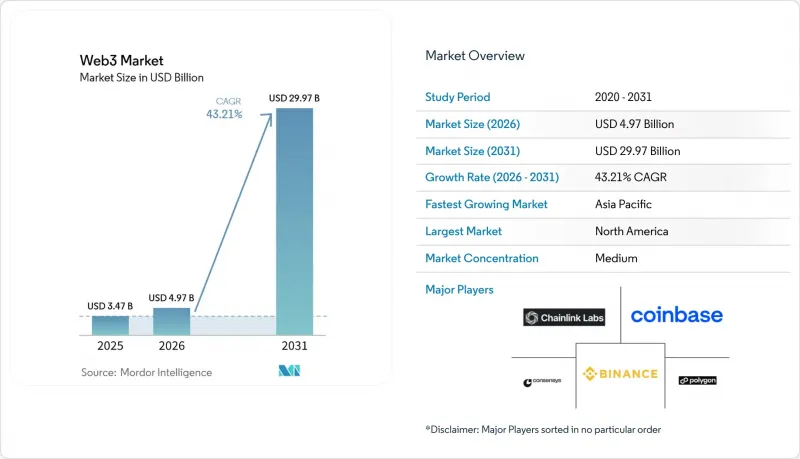
According to Mordor Intelligence, the web3 market size is projected to expand from USD 3.47 billion in 2025 and USD 4.97 billion in 2026 to USD 29.97 billion by 2031, registering a CAGR of 43.21% between 2026 to 2031.
This report is Segmented by Blockchain Layer (Layer-1, Layer-2, Layer-3), Application (Cryptocurrency Payments and Exchange, Decentralised Finance, and More), End-Use Industry (BFSI, E-Commerce and Retail, Media, Entertainment and Sports, and More), Deployment Model (Public/Permissionless Chains, Private/Permissioned Chains, and More), and Geography. The Market Forecasts are Provided in Terms of Value (USD).
Global Web3 Market Trends and Insights
Rising Enterprise Blockchain Adoption
Global corporations now deploy blockchain for supply-chain, settlement, and identity, transitioning from pilots to production. Coinbase captured USD 2.03 billion institutional revenue in Q1 2025, confirming the scale of corporate demand for compliant crypto rails . JPMorgan's Onyx platform extends beyond internal transfers, offering tokenized settlement to clients, while California's DMV digitized 42 million car titles on Avalanche, illustrating government use cases. Mature APIs reduce integration costs, and enterprise middleware abstracts protocol complexity, allowing traditional IT teams to onboard blockchain safely.
Surge in DeFi and NFT Transactions
Institutional allocations above USD 100 billion flowed into DeFi during 2024 as asset managers tokenized funds and provided liquidity, stabilizing yields. NFT volumes rebounded in 2025 on utility-driven programs by brands such as Nike, integrating tokens into loyalty ecosystems. Cross-pollination of DeFi and NFTs underpins new products like NFT-collateralized loans, broadening the Web3 market addressable base. Account abstraction and gasless transactions elevate user experience, driving retail participation.
Evolving Multi-Jurisdictional Compliance Burden
Disparate data-protection, tax, and securities rules oblige firms to tailor deployments country by country, inflating legal overheads. GDPR's erasure provisions collide with blockchain immutability, forcing technical workarounds such as off-chain storage pointers. Smaller providers struggle to fund compliance, widening the gap between incumbents and start-ups.
Other drivers and restraints analyzed in the detailed report include:
- Growing Regulatory Clarity in G20 Economies
- Layer-2 Scaling Cuts Transaction Costs
- High-Profile Smart-Contract Exploits
For complete list of drivers and restraints, kindly check the Table Of Contents.
Segment Analysis
Layer-1 chains retained 76.45% revenue in 2025, yet Layer-3 solutions now record a 46.40% CAGR. The Web3 market size for specialized Layer-3 chains is expected to expand rapidly as firms seek tailored governance and compliance features. Bitcoin remains the dominant value store, while Ethereum's proof-of-stake model supports complex smart-contract logic. Solana's high throughput attracts gaming platforms, though its past network outages limit regulated-sector uptake. Avalanche and Cardano pursue sector-specific rollouts, including government registries and academic pilots. Continued demand for customization underscores why Layer-3 design is outpacing generic Layer-2 scaling in enterprise roadmaps.
Demand for seamless liquidity drives projects like Polygon's AggLayer, which combines multiple execution layers into one ecosystem, lowering developer fragmentation. Alchemy supports more than 1 million smart accounts across Layer-1 and Layer-2 networks, enabling rapid experimentation. The Web3 market is therefore bifurcating: one track optimizes global decentralization, the other maximizes sector fit via nested chains.
Cryptocurrency payments and exchanges commanded 65.05% of the Web3 market size in 2025 as stablecoins became the de-facto digital settlement layer. Decentralized finance follows with the highest 44.00% CAGR, led by tokenized treasuries, on-chain repo, and yield strategies attractive to cash-rich corporates. Protocol integrations by PayPal and Stripe into traditional checkout flows signal mainstream payment acceptance. NFT platforms have moved from collectibles to verification tools in ticketing, luxury goods, and fan engagement.
Web3 gaming introduces player-owned asset models, though regulatory clarity on token classification remains a gating factor. Supply-chain provenance systems relied on blockchain to track pharmaceuticals and food safety, drawing interest from Walmart and leading drug manufacturers. As account abstraction reduces mnemonic-based onboarding, consumer apps see conversion improvements, broadening Web3 market penetration.
Geography Analysis
North America contributed 39.05% of 2025 revenue due to robust venture funding, deep developer talent, and enterprise blockchain initiatives. Coinbase's USD 2.03 billion institutional revenue highlights liquidity concentration, while AWS's managed blockchain services offer familiar deployment environments for corporate clients. California's DMV blockchain rollout demonstrates government appetite for decentralized registries, reinforcing regional leadership.
Asia-Pacific is the fastest-growing Web3 market, forecast to rise at 45.90% CAGR. Singapore's licensing regime and investment incentives attract exchanges and custodians, creating an innovation nucleus. Japan's tax relief and national Web3 roadmap spurred Sony's USD 3.5 million stake in Startale Labs, validating corporate commitment . India and Indonesia rank first and third globally for crypto adoption volumes, underlining massive consumer bases for forthcoming applications.
Europe benefits from MiCA-driven regulatory certainty. The framework aligns with blockchain's emphasis on user control over data, encouraging identity and privacy products tailored to GDPR. South America pilots decentralized IDs in Brazil and explores remittance solutions in Mexico. The Middle East and Africa focus on financial inclusion and CBDC research, though fragmented rules temper near-term scaling.
- Binance Holdings Ltd.
- Coinbase Global Inc.
- ConsenSys Software Inc.
- Polygon Labs Ltd.
- Chainlink Labs Ltd.
- Amazon Web Services Inc.
- QuickNode
- Alchemy Insights Inc.
- Biconomy Ltd.
- Moralis AB
- Helium Foundation Inc.
- Ripple Labs Inc.
- Kraken Digital Asset Exchange
- OKX FinTech Co. Ltd.
- Animoca Brands Corp. Ltd.
- Solana Foundation Ltd.
- Circle Internet Financial LLC
- Dapper Labs Inc.
- Immutable Pty Ltd.
Additional Benefits:
- The market estimate (ME) sheet in Excel format
- 3 months of analyst support
TABLE OF CONTENTS
1 INTRODUCTION
- 1.1 Market Definition and Study Assumptions
- 1.2 Scope of the Study
2 RESEARCH METHODOLOGY
3 EXECUTIVE SUMMARY
4 MARKET LANDSCAPE
- 4.1 Market Overview
- 4.2 Market Drivers
- 4.2.1 Rising enterprise blockchain adoption
- 4.2.2 Surge in DeFi and NFT transactions
- 4.2.3 Growing regulatory clarity in G20 economies
- 4.2.4 Layer-2 scaling cuts transaction costs
- 4.2.5 Government integration of decentralized IDs
- 4.2.6 Composable AI agents in Web3 stacks
- 4.3 Market Restraints
- 4.3.1 Evolving multi-jurisdictional compliance burden
- 4.3.2 High-profile smart-contract exploits
- 4.3.3 ESG-driven energy-consumption scrutiny
- 4.3.4 Reliance on few infra gateways (e.g., RPC hubs)
- 4.4 Value / Supply-Chain Analysis
- 4.5 Evaluation of Critical Regulatory Framework
- 4.6 Impact Assessment of Key Stakeholders
- 4.7 Technological Outlook
- 4.8 Porter's Five Forces Analysis
- 4.8.1 Bargaining Power of Suppliers
- 4.8.2 Bargaining Power of Consumers
- 4.8.3 Threat of New Entrants
- 4.8.4 Threat of Substitutes
- 4.8.5 Intensity of Competitive Rivalry
- 4.9 Impact of Macro-economic Factors
5 MARKET SIZE AND GROWTH FORECASTS (VALUE)
- 5.1 By Blockchain Layer
- 5.1.1 Layer-1
- 5.1.2 Layer-2
- 5.1.3 Layer-3
- 5.2 By Application
- 5.2.1 Cryptocurrency Payments and Exchange
- 5.2.2 Decentralised Finance (DeFi)
- 5.2.3 NFTs and Digital Collectibles
- 5.2.4 Web3 Gaming and Metaverse
- 5.2.5 Social and Creator Economy
- 5.2.6 Supply-chain and Provenance
- 5.2.7 Identity and Privacy
- 5.3 By End-use Industry
- 5.3.1 BFSI
- 5.3.2 E-commerce and Retail
- 5.3.3 Media, Entertainment and Sports
- 5.3.4 Healthcare and Life Sciences
- 5.3.5 IT and Telecom
- 5.3.6 Government and Public Sector
- 5.4 By Deployment Model
- 5.4.1 Public / Permissionless Chains
- 5.4.2 Private / Permissioned Chains
- 5.4.3 Consortium / Hybrid Chains
- 5.5 Geography
- 5.5.1 North America
- 5.5.1.1 United States
- 5.5.1.2 Canada
- 5.5.1.3 Mexico
- 5.5.2 South America
- 5.5.2.1 Brazil
- 5.5.2.2 Argentina
- 5.5.2.3 Rest of South America
- 5.5.3 Europe
- 5.5.3.1 Germany
- 5.5.3.2 United Kingdom
- 5.5.3.3 France
- 5.5.3.4 Italy
- 5.5.3.5 Spain
- 5.5.3.6 Russia
- 5.5.3.7 Rest of Europe
- 5.5.4 Asia-Pacific
- 5.5.4.1 China
- 5.5.4.2 Japan
- 5.5.4.3 India
- 5.5.4.4 South Korea
- 5.5.4.5 Australia and New Zealand
- 5.5.4.6 Rest of Asia-Pacific
- 5.5.5 Middle East and Africa
- 5.5.5.1 Middle East
- 5.5.5.1.1 Saudi Arabia
- 5.5.5.1.2 United Arab Emirates
- 5.5.5.1.3 Turkey
- 5.5.5.1.4 Rest of Middle East
- 5.5.5.2 Africa
- 5.5.5.2.1 South Africa
- 5.5.5.2.2 Nigeria
- 5.5.5.2.3 Egypt
- 5.5.5.2.4 Rest of Africa
- 5.5.5.1 Middle East
- 5.5.1 North America
6 COMPETITIVE LANDSCAPE
- 6.1 Market Concentration
- 6.2 Strategic Moves
- 6.3 Market Share Analysis
- 6.4 Company Profiles (includes Global level Overview, Market level overview, Core Segments, Financials as available, Strategic Information, Market Rank/Share for key companies, Products and Services, and Recent Developments)
- 6.4.1 Binance Holdings Ltd.
- 6.4.2 Coinbase Global Inc.
- 6.4.3 ConsenSys Software Inc.
- 6.4.4 Polygon Labs Ltd.
- 6.4.5 Chainlink Labs Ltd.
- 6.4.6 Amazon Web Services Inc.
- 6.4.7 QuickNode
- 6.4.8 Alchemy Insights Inc.
- 6.4.9 Biconomy Ltd.
- 6.4.10 Moralis AB
- 6.4.11 Helium Foundation Inc.
- 6.4.12 Ripple Labs Inc.
- 6.4.13 Kraken Digital Asset Exchange
- 6.4.14 OKX FinTech Co. Ltd.
- 6.4.15 Animoca Brands Corp. Ltd.
- 6.4.16 Solana Foundation Ltd.
- 6.4.17 Circle Internet Financial LLC
- 6.4.18 Dapper Labs Inc.
- 6.4.19 Immutable Pty Ltd.
7 MARKET OPPORTUNITIES AND FUTURE TRENDS
- 7.1 White-space and Unmet-need Assessment

