
PUBLISHER: Mordor Intelligence | PRODUCT CODE: 2062024

PUBLISHER: Mordor Intelligence | PRODUCT CODE: 2062024
United States Food Logistics - Market Share Analysis, Industry Trends & Statistics, Growth Forecasts (2026 - 2031)
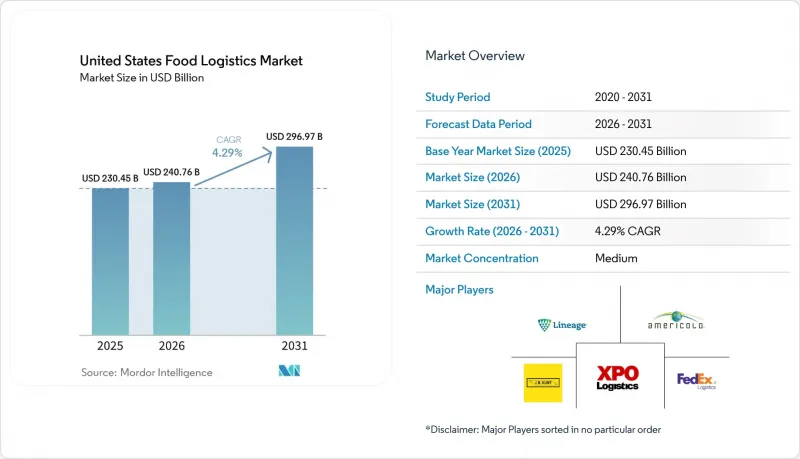
According to Mordor Intelligence, the united states food logistics market size was valued at USD 230.45 billion in 2025 and is estimated to grow from USD 240.76 billion in 2026 to reach USD 296.97 billion by 2031, at a CAGR of 4.29% during the forecast period (2026-2031).
This report is Segmented by Services (Transportation, Warehousing, Value-Added Services and Others), by Temperature-Control Type (Cold Chain and Non-Cold Chain), by End-Product Category (Meat & Seafood, Dairy & Frozen Desserts, Fruits & Vegetables, Food and Beverages, and Others). The Market Forecasts are Provided in Terms of Value USD.
United States Food Logistics Market Trends and Insights
E-commerce and Online Grocery Growth
United States retail e-commerce sales reached USD 316.1 billion in Q4 2025, up 5.3% year over year, and full-year 2025 online retail hit USD 1.23 trillion with a 16.4% penetration rate, which increases temperature-controlled deliveries and raises last-mile orchestration complexity across the United States food logistics market. Grocery and food and beverage stores report USD 77.5 billion in January 2026 sales, up 1.9% year over year, underscoring the continued importance of micro-fulfillment and dark-store models for reliable service windows near high-density demand. Networks shift from hub-spoke to spoke-spoke layouts and emphasize smaller drop sizes with higher order frequency, which puts a premium on slotting accuracy and real-time visibility in the United States food logistics market. Perishable fulfillment leaves little tolerance for substitutions or delays, so operators deploy temperature telematics, dynamic routing, and predictive labor planning to protect service levels and reduce spoilage. E-commerce penetration is expected to edge higher in 2026, with food and beverage maintaining momentum as retailers expand owned fleets and click-and-collect options that streamline handoffs and rebalance margin capture in the United States food logistics market.
Cold Chain Infrastructure Expansion
USDA's Resilient Food Systems Infrastructure program is channeling funding to aggregation, processing, and cold storage capacity to ease mid-supply chain bottlenecks in perishable categories that rely on dependable temperature control in the United States food logistics market. Additional 2024 awards to independent meat and poultry processors help diversify slaughter capacity and reduce exposure to highly concentrated processing clusters that distort regional flows. USDA's USD 2 billion for specialty crops recognizes the higher logistics costs for fresh produce and supports climate-controlled transport assets that can lower in-transit loss in berries, leafy greens, and other sensitive SKUs. Private capital aligns with this shift, as DHL Supply Chain's February 2026 MOU with RLCold targets more than five million square feet of next-generation multi-temperature capacity with FSMA-ready controls and airtight designs that replace aging stock in the United States food logistics market. Groundbreaking-to-ramp timelines of 24 to 36 months stage the relief, but pre-leasing and anchor commitments lock in tenants and pricing, which improves planning horizons for shippers that depend on cold-chain reliability in the United States food logistics market.
Driver Shortage and Labor Challenges
Transportation sector unemployment reached 5.9% in August 2025, above the national 4.5% rate, while truck transportation employment grew 0.4% year over year, which kept capacity tight and exposed mismatches in driver supply for the United States food logistics market. The Bureau of Labor Statistics projects 237,600 average annual openings for heavy and tractor-trailer drivers through 2034, driven largely by retirements and career exits, which sustains recruiting pressure despite solid demand. Hours-of-service limits cap daily driving at 11 hours within a 14-hour window and require weekly resets, which constrain asset utilization and force fleets to carry more tractors and drivers for a given route network. Wage inflation in labor-intensive functions such as loading and receiving adds cost at docks, especially in temperature-controlled facilities that must maintain strict standards during peak windows. Leaders invest in automation and robotic retrieval to stabilize throughput, reduce per-order labor, and keep service levels high in the United States food logistics market.
Other drivers and restraints analyzed in the detailed report include:
- Consumer Demand for Fresh and Perishable Foods
- Restaurant and Foodservice Industry Recovery
- Infrastructure Constraints and Congestion
For complete list of drivers and restraints, kindly check the Table Of Contents.
Segment Analysis
Transportation services captured 53.78% of the United States food logistics market share in 2025, confirming the central role of road, rail, water, and air networks to align perishables with service windows across national and cross-border flows. Road transport supports last-mile precision and door-to-door control over temperature, while rail intermodal and refrigerated containers gain share where time sensitivity allows multi-day transits for frozen proteins and grains. Waterborne imports move produce and seafood through Savannah, Long Beach, and Newark, and air remains a targeted option for high-value seafood. Value-added services expand at 5.8% annually as operators embed co-packing, kitting, labeling, and postponement tactics that reduce finished-goods risk and respond faster to real demand signals in the United States food logistics market. These capabilities move the profit pool from cubic footage toward complexity management and traceability-ready execution that supports regulated categories and rapid channel shifts.
Warehousing anchors cross-docking, order consolidation, and temperature stabilization between production and outbound flows, and dwell lengths reflect the added traceability steps required for event-level verification in covered categories. Leading networks deploy automated retrieval and warehouse execution software to compress pick-to-ship cycles, protect product integrity, and reduce energy per pallet in the United States food logistics market. Legacy facilities without automation or energy retrofits face pressure from rising labor and utility costs, while technology-forward nodes price at a premium for bundled co-packing and audit-ready visibility. The United States food logistics market rewards providers that integrate transportation, warehousing, and value-added operations under one control tower to reduce touches and exception rates. The United States food logistics market size for value-added services is projected to expand at a 5.8% CAGR between 2026 and 2031, reflecting durable demand for traceability, postponement, and compliance support. Operators in the United States food logistics industry that standardize automation, software, and renewable energy adoption across sites improve margins and resilience against labor and energy volatility.
List of Companies Covered in this Report:
- Lineage Logistics
- Americold Logistics
- XPO Logistics
- J.B. Hunt Transport Services
- FedEx Logistics
- United Parcel Service, Inc.
- C.H. Robinson Worldwide
- DHL Group
- Kuehne + Nagel
- CTW Logistics
- Buske Logistics
- Kenco Logistics
- Covenant Logistics Group
- Transervice Logistics
- RLS Logistics
- Expeditors
- GEODIS
- Penske Logistics
- Matson Logistics
- Averitt Express
Additional Benefits:
- The market estimate (ME) sheet in Excel format
- 3 months of analyst support
TABLE OF CONTENTS
1 Introduction
- 1.1 Study Assumptions & Market Definition
- 1.2 Scope of the Study
2 Research Methodology
3 Executive Summary
4 Market Landscape
- 4.1 Market Overview
- 4.2 Market Drivers
- 4.2.1 E-commerce and Online Grocery Growth
- 4.2.2 Cold Chain Infrastructure Expansion
- 4.2.3 Food Safety Regulations and Traceability
- 4.2.4 Consumer Demand for Fresh and Perishable Foods
- 4.2.5 Restaurant and Foodservice Industry Recovery
- 4.2.6 Sustainability and Waste Reduction Initiatives
- 4.3 Market Restraints
- 4.3.1 Driver Shortage and Labor Challenges
- 4.3.2 High Cold Chain Infrastructure Costs
- 4.3.3 Food Waste and Spoilage Risks
- 4.3.4 Infrastructure Constraints and Congestion
- 4.4 Value / Supply-Chain Analysis
- 4.5 Regulatory Landscape
- 4.6 Technological Outlook
- 4.7 Porter's Five Forces
- 4.7.1 Threat of New Entrants
- 4.7.2 Bargaining Power of Suppliers
- 4.7.3 Bargaining Power of Buyers
- 4.7.4 Threat of Substitutes
- 4.7.5 Competitive Rivalry
- 4.8 Hyperlocal Fulfillment Networks Emerging
- 4.9 Third-Party Logistics Specialization Accelerating
5 Market Size & Growth Forecasts (Value)
- 5.1 By Services
- 5.1.1 Transportation
- 5.1.1.1 Road
- 5.1.1.2 Rail
- 5.1.1.3 Water
- 5.1.1.4 Air
- 5.1.2 Warehousing
- 5.1.3 Value-Added Services and Others
- 5.1.1 Transportation
- 5.2 By Temperature-Control Type
- 5.2.1 Cold Chain
- 5.2.1.1 Ambient 15-25 °C
- 5.2.1.2 Chilled 2-8 °C
- 5.2.1.3 Frozen Less than 0 °C
- 5.2.2 Non-Cold Chain
- 5.2.1 Cold Chain
- 5.3 By End-Product Category
- 5.3.1 Meat & Seafood
- 5.3.2 Dairy & Frozen Desserts
- 5.3.3 Fruits & Vegetables
- 5.3.4 Food and Beverages
- 5.3.5 Others
6 Competitive Landscape
- 6.1 Market Concentration
- 6.2 Strategic Moves
- 6.3 Market Share Analysis
- 6.4 Company Profiles (includes Global level Overview, Market level overview, Core Segments, Financials as available, Strategic Information, Market Rank/Share for key companies, Products & Services, and Recent Developments)
- 6.4.1 Lineage Logistics
- 6.4.2 Americold Logistics
- 6.4.3 XPO Logistics
- 6.4.4 J.B. Hunt Transport Services
- 6.4.5 FedEx Logistics
- 6.4.6 United Parcel Service, Inc.
- 6.4.7 C.H. Robinson Worldwide
- 6.4.8 DHL Group
- 6.4.9 Kuehne + Nagel
- 6.4.10 CTW Logistics
- 6.4.11 Buske Logistics
- 6.4.12 Kenco Logistics
- 6.4.13 Covenant Logistics Group
- 6.4.14 Transervice Logistics
- 6.4.15 RLS Logistics
- 6.4.16 Expeditors
- 6.4.17 GEODIS
- 6.4.18 Penske Logistics
- 6.4.19 Matson Logistics
- 6.4.20 Averitt Express
7 Market Opportunities & Future Outlook

