
PUBLISHER: Mordor Intelligence | PRODUCT CODE: 2063355

PUBLISHER: Mordor Intelligence | PRODUCT CODE: 2063355
Government And Education Logistics - Market Share Analysis, Industry Trends & Statistics, Growth Forecasts (2026 - 2031)
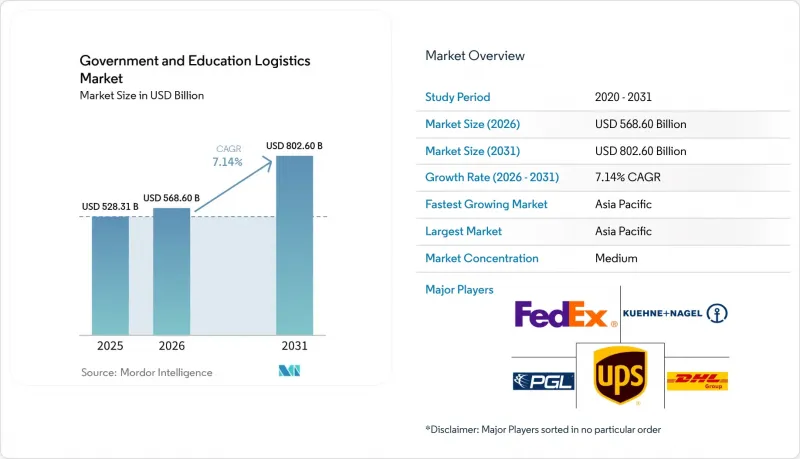
According to Mordor Intelligence, the government and education logistics market size is expected to increase from USD 528.31 billion in 2025 to USD 568.60 billion in 2026 and reach USD 802.60 billion by 2031, growing at a CAGR of 7.14% over 2026-2031.
Public-sector buyers are shifting from lowest-price contracting toward network resilience, emissions reduction, and digital transparency. This report is Segmented by Service Type (Transportation, Warehousing & Storage, and Value-Added Services), by End-User (Central/Federal Government, State & Local Government, Defense Agencies, Public Education, and More), and by Geography (North America, South America, Asia-Pacific, Europe, and Middle East and Africa). The Market Forecasts are Provided in Terms of Value (USD).
Global Government And Education Logistics Market Trends and Insights
Mandated Decarbonization & Green-Procurement Targets
Public agencies now embed emissions caps and local-content rules into every tender. The EU's Clean Vehicles Directive, with mandatory procurement targets for 2025 and 2030, obliges members to favor electric vehicles and rail, while U.S. states such as Maryland require carbon disclosure for logistics serving public construction. International Institute for Sustainable Development analysis shows green rules have successfully driven down supply chain emissions but lifted upfront contract costs, prompting agencies to sign longer-term deals so carriers can amortize low-carbon fleets. Smaller haulers unable to finance electric trucks are exiting bids, concentrating volumes with global integrators.
Post-Pandemic Contingency Planning for Resilient Public Supply Chains
After COVID-19 shortages, governments treat logistics resilience as a national security priority rather than just a procurement efficiency lever. Building on executive actions such as the establishment of the White House Council on Supply Chain Resilience, federal agencies are increasingly directed to map critical dependencies and prioritize dual-sourcing. Specific initiatives, such as the Department of Health and Human Services' push to decentralize and expand the Strategic National Stockpile through split-warehouse networks and vendor-managed inventory, have boosted logistics leasing in secondary markets. Furthermore, federal procurement guidelines are increasingly favoring carriers with robust, redundant domestic networks. While prioritizing buffer stock and network redundancy inherently lifts total logistics costs, these investments remain non-negotiable for public procurement officers determined to avoid repeat disruptions.
Global Container-Capacity Volatility Impacting Cost Predictability
Red Sea security incidents and drought-affected Panama Canal transits have lengthened routes and inflated bunker fuel costs by up to 40% since 2024. Public buyers insist on fixed prices, so carriers absorb volatility or risk losing bids. Smaller forwarders absent hedging programs exit tenders, further consolidating the government and education logistics market around integrators able to cushion spot spikes.
Other drivers and restraints analyzed in the detailed report include:
- Expansion of Satellite Campuses in Emerging Countries Creating New Logistics Corridors
- Growth in Defense R&D Partnerships with Universities Driving Classified Material Flows
- Shortage of Security-Cleared Logistics Personnel
For complete list of drivers and restraints, kindly check the Table Of Contents.
Segment Analysis
Value-Added services accounted for the fastest growth in 2025 and are forecast to rise at a 10.57% CAGR through 2031, while Transportation retained the largest 49.66% slice of the government and education logistics market share in 2025. Agencies now expect reverse logistics for refurbished laptops, kitting for pre-portioned school meals, and compliance labeling for controlled goods. U.S. Environmental Protection Agency circular-procurement rules require de-installation, secure transport, and certified data wiping of end-of-life devices, creating premium demand for providers that track assets from pickup through resale.
Growing reliance on robotics and radio-frequency identification boosts the government and education logistics market size for integrated service suites. UPS equipped all U.S. package cars with RFID readers in 2025, giving public buyers real-time inventory visibility for research prototypes. Automation lowers unit fulfillment cost, letting carriers bundle warehousing, refurbishment, and distribution into multi-year contracts priced below in-house benchmarks. Transportation remains indispensable, especially road haulage for short-haul deliveries and rail for long-distance bulk moves, yet the margin frontier is shifting toward tech-enabled value-added services with double-digit profit potential.
Geography Analysis
Asia-Pacific held 40.67% of 2025 revenue and is projected to grow at an 8.60% CAGR to 2031, underpinned by India's Government e-Marketplace, China's Belt and Road university projects, and Southeast Asia's digital-campus boom. India processed more than USD 30 billion in public purchases on GeM during 2025, and embedded real-time vendor scoring now rewards logistics firms that meet aggressive on-time metrics. Chinese partnerships across Central Asia funnel scientific instruments through bonded corridors, and the Association of Southeast Asian Nations' duty harmonization lifts intra-regional textbook flows. Australia and South Korea add ITAR-compliant traffic as defense research proliferates, while Japan pilots autonomous on-campus delivery robots within its Society 5.0 program.
North America remains the contractual anchor of the government and education logistics market, supported by U.S. federal spending that topped USD 700 billion in 2024 and Canadian provincial investments in rural broadband. The U.S. General Services Administration is consolidating contract vehicles under OASIS+ and Polaris, trimming the field of eligible bidders yet streamlining procurement cycles. secured the primary USPS air-cargo slot in 2024, demonstrating that integrated ground-and-air networks matter more than legacy tenure. Mexico's nearshoring surge attracts cross-border education-equipment flows, although customs chokepoints and California port congestion still test schedule reliability.
Europe's outlook hinges on tightening environmental regulations, such as the Clean Vehicles Directive, which forces public buyers to prioritize low-carbon and zero-emission lanes. This requirement pushes many traditional carriers to upgrade their fleets or form joint ventures to remain compliant with green public procurement standards. BENELUX and Nordic states are early adopters of digitized e-CMR (electronic consignment notes), obliging 3PLs to integrate with advanced digital tracking platforms for asset provenance. Eastern European education infrastructure receives EU cohesion funds, yet currency volatility and regulatory fragmentation complicate pricing, compelling carriers to add risk premia or cap exposure.
- DHL Group
- FedEx
- United Parcel Service, Inc. (UPS)
- Kuehne + Nagel International AG
- PGL (Primary Global Logistics)
- DSV
- CEVA Logistics (CMA CGM)
- XPO
- BDP International
- GEODIS
- Maersk Logistics & Services
- Scan Global Logistics
- PLS Logistics
- SEKO Logistics
- Rhenus Logistics
- Expeditors International
- Toll Group
- Atlantic Logistics
- Logistics Plus Inc.
- Noble Supply & Logistics
Additional Benefits:
- The market estimate (ME) sheet in Excel format
- 3 months of analyst support
TABLE OF CONTENTS
1 Introduction
- 1.1 Study Assumptions & Market Definition
- 1.2 Scope of the Study
2 Research Methodology
3 Executive Summary
4 Market Landscape
- 4.1 Market Overview
- 4.2 Market Drivers
- 4.2.1 Mandated Decarbonization & Green-Procurement Targets
- 4.2.2 Post-Pandemic Contingency Planning for Resilient Public Supply Chains
- 4.2.3 Expansion of Satellite Campuses in Emerging Countries Creating New Logistics Corridors
- 4.2.4 Growth in Defense R&D Partnerships with Universities Driving Classified Material Flows
- 4.2.5 Blockchain-Based Credential & Asset Tracking Adoption Across Government Inventories
- 4.2.6 Rural Broadband Stimulus Fueling Large-Scale Educational Equipment Deployments
- 4.3 Market Restraints
- 4.3.1 Global Container-Capacity Volatility Impacting Cost Predictability
- 4.3.2 Shortage of Security-Cleared Logistics Personnel
- 4.3.3 Fragmented Last-Mile Infrastructure in Low-Density Education Districts
- 4.3.4 Escalating Cybersecurity Mandates Increasing IT Integration Costs
- 4.4 Value / Supply-Chain Analysis
- 4.5 Regulatory Landscape
- 4.6 Technological Outlook
- 4.7 Porter's Five Forces
- 4.7.1 Threat of New Entrants
- 4.7.2 Bargaining Power of Suppliers
- 4.7.3 Bargaining Power of Buyers
- 4.7.4 Threat of Substitutes
- 4.7.5 Competitive Rivalry
5 Market Size & Growth Forecasts
- 5.1 By Service Type
- 5.1.1 Transportation
- 5.1.1.1 Road
- 5.1.1.2 Rail
- 5.1.1.3 Air
- 5.1.1.4 Sea and Inland Waterway
- 5.1.2 Warehousing & Storage
- 5.1.3 Value-Added Services
- 5.1.1 Transportation
- 5.2 By End-User
- 5.2.1 Central/Federal Government
- 5.2.2 State & Local Government
- 5.2.3 Defense Agencies
- 5.2.4 Public Education (K-12)
- 5.2.5 Higher Education Institutions
- 5.2.6 Others
- 5.3 By Geography
- 5.3.1 North America
- 5.3.1.1 United States
- 5.3.1.2 Canada
- 5.3.1.3 Mexico
- 5.3.2 South America
- 5.3.2.1 Brazil
- 5.3.2.2 Peru
- 5.3.2.3 Chile
- 5.3.2.4 Argentina
- 5.3.2.5 Rest of South America
- 5.3.3 Asia-Pacific
- 5.3.3.1 India
- 5.3.3.2 China
- 5.3.3.3 Japan
- 5.3.3.4 Australia
- 5.3.3.5 South Korea
- 5.3.3.6 South East Asia (Singapore, Malaysia, Thailand, Indonesia, Vietnam, and Philippines)
- 5.3.3.7 Rest of Asia-Pacific
- 5.3.4 Europe
- 5.3.4.1 United Kingdom
- 5.3.4.2 Germany
- 5.3.4.3 France
- 5.3.4.4 Spain
- 5.3.4.5 Italy
- 5.3.4.6 BENELUX (Belgium, Netherlands, and Luxembourg)
- 5.3.4.7 NORDICS (Denmark, Finland, Iceland, Norway, and Sweden)
- 5.3.4.8 Rest of Europe
- 5.3.5 Middle East and Africa
- 5.3.5.1 United Arab of Emirates
- 5.3.5.2 Saudi Arabia
- 5.3.5.3 South Africa
- 5.3.5.4 Nigeria
- 5.3.5.5 Rest of Middle East And Africa
- 5.3.1 North America
6 Competitive Landscape
- 6.1 Market Concentration
- 6.2 Strategic Moves
- 6.3 Market Share Analysis
- 6.4 Company Profiles (includes Global level Overview, Market level overview, Core Segments, Financials as available, Strategic Information, Market Rank/Share for key companies, Products & Services, and Recent Developments)
- 6.4.1 DHL Group
- 6.4.2 FedEx
- 6.4.3 United Parcel Service, Inc. (UPS)
- 6.4.4 Kuehne + Nagel International AG
- 6.4.5 PGL (Primary Global Logistics)
- 6.4.6 DSV
- 6.4.7 CEVA Logistics (CMA CGM)
- 6.4.8 XPO
- 6.4.9 BDP International
- 6.4.10 GEODIS
- 6.4.11 Maersk Logistics & Services
- 6.4.12 Scan Global Logistics
- 6.4.13 PLS Logistics
- 6.4.14 SEKO Logistics
- 6.4.15 Rhenus Logistics
- 6.4.16 Expeditors International
- 6.4.17 Toll Group
- 6.4.18 Atlantic Logistics
- 6.4.19 Logistics Plus Inc.
- 6.4.20 Noble Supply & Logistics
7 Market Opportunities & Future Outlook
- 7.1 White-space & Unmet-need Assessment

