
PUBLISHER: Mordor Intelligence | PRODUCT CODE: 2072574

PUBLISHER: Mordor Intelligence | PRODUCT CODE: 2072574
Ethernet Switch - Market Share Analysis, Industry Trends & Statistics, Growth Forecasts (2026 - 2031)
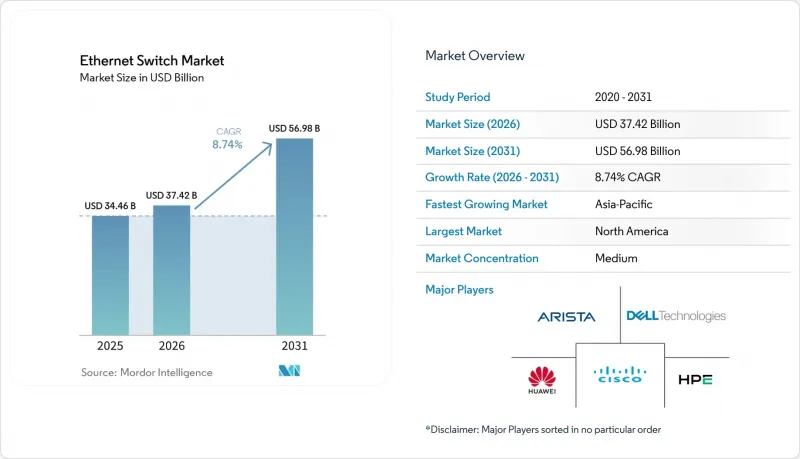
According to Mordor Intelligence, the ethernet switch market size is expected to increase from USD 34.46 billion in 2025 to USD 37.42 billion in 2026 and reach USD 56.98 billion by 2031, growing at a CAGR of 8.74% over 2026-2031.
This report is Segmented by Switch Type (Fixed Configuration Switches, and Modular Switches), Port Speed (1 GbE and Below, 2. 5/5 GbE, 10 GbE, and More), End User (Cloud and Data Center Providers, Enterprise (Commercial Offices and Campuses), and More), Management Type (Smart / Web-Managed Switches, Unmanaged Switches, and More), and Geography. The Market Forecasts are Provided in Terms of Value (USD).
Global Ethernet Switch Market Trends and Insights
Increasing Bandwidth Demand From AI Workloads
Generative-AI training clusters require low-latency fabrics that legacy 100-gigabit gear cannot satisfy. Meta's Prometheus supercomputer, online since December 2025, connects GPUs with NVIDIA Spectrum-X switches operating at 800 gigabits per second, illustrating Ethernet's cost advantage over InfiniBand. Oracle Cloud followed in 2025, citing a 1.6-times throughput gain from adaptive routing built into the same platform. Hyperscalers are now aiming for 1:1 oversubscription ratios, effectively doubling the number of ports per rack. NVIDIA locked in USD 2 billion of custom switch ASIC supply from Marvell to guarantee capacity for its DGX SuperPOD architecture. As AI clusters scale past 1 GW of power draw, 800G Ethernet emerges as the default spine-and-leaf choice for new builds.
Proliferation of Cloud Data Centers
Capital expense among hyperscalers continues to surge, with multibillion-dollar campuses breaking ground in every major region. Google's Virgo AI cluster, unveiled in 2025, chains custom 800 gigabit switches across availability zones to reduce latency between tensor-processing units. Microsoft's USD 15.2 billion commitment to a 5 GW facility in the United Arab Emirates underscores how liquid cooling enables denser racks, thereby requiring modular chassis capable of aggregating 576 ports of 800 gigabit Ethernet per spine. Open networking stacks such as SONiC are accelerating in these environments; Microsoft, Meta, and LinkedIn submitted more than 1,000 code commits during 2024, trimming feature roll-out cycles.
High CapEx for 400G and 800G Upgrades
A 64-port 800 gigabit switch lists near USD 200,000, and optics add USD 1,000-3,000 per port, straining budgets outside hyperscale circles. Linear pluggable optics are lowering per-bit cost; Arista's XPO modules announced in April 2026 deliver 12.8 Tbps each while trimming power budgets. Even so, many European enterprises defer refreshes because the region's energy-efficiency code pushes operators toward platforms under 100 gigabit per port. Consumption-based leasing eases near-term cash flow but ultimately spreads expenses across longer periods.
Other drivers and restraints analyzed in the detailed report include:
- Growth of Edge Data Centers in Tier-2 Cities
- Rising Adoption of PoE and IoT-Enabled Devices
- Semiconductor Supply Chain Disruptions
For complete list of drivers and restraints, kindly check the Table Of Contents.
Segment Analysis
Fixed configuration units dominated shipments with 76.38% share in 2025, anchoring campus access layers, retail branches, and industrial facilities where port counts hover under 48. Modular chassis, though smaller in footprint, are expanding at a 10.18% CAGR as hyperscalers demand spine fabrics that grow line cards by line card without forklift swaps. Arista's 7800R4 platform supports 576 800 G ports and delivers 230.4 Tbps of aggregate throughput. Cisco's Nexus 9800 refresh in December 2025 rivals that ceiling at 115.2 Tbps while layering in real-time telemetry.
The cost-performance trade-off continues to shape buyer choices. Unmanaged fixed switches posting 9.11% CAGR serve IoT rollouts where administrators favor plug-and-play. Smart web-managed tiers bridge small enterprises into VLAN and QoS without the cost of full software-defined networking. Fully managed fixed gear anchors campus cores, integrating with identity-aware policies and segmentation. Modular adoption will remain hyperscale-centric, but mid-market colocation providers are starting to spec chassis to future-proof against unpredictable AI tenant bursts.
Legacy 1-gigabit still claimed 31.12% of the Ethernet switch market share in 2025, amid cost-sensitive small offices and industrial sensor fields. At the opposite end, the 400-gigabit-and-above tier is charting a 13.63% CAGR as GPU clusters and analytics pipelines overwhelm older fabrics. Meta recorded 1.6X higher effective throughput when shifting Prometheus from InfiniBand to 800 gigabit Ethernet with adaptive routing.
Multi-gigabit 2.5/5 GbE is bridging the gap to WiFi 7 refreshes, while 10 GbE remains the backbone of mid-sized data centers that cannot yet cost-justify 100 GbE. Buyers are leapfrogging 25/40 GbE straight to 100 GbE, compressing the middle of the curve. Arista's April 2026 XPO optics slash per-port power draw, enabling 800 GbE in top-of-rack footprints once limited to 100 GbE. These advances will steadily erode the legacy share, though a long tail of industrial endpoints ensures 1 GbE persists well into the next decade.
Complete Report Scope:
- By Switch Type
- Fixed Configuration Switches
- Modular Switches
- By Port Speed
- 1 GbE and Below
- 2.5/5 GbE Multi-Gig
- 10 GbE
- 25/40 GbE
- 100 GbE
- 400 GbE and Above
- By End-User
- Cloud and Data Center Providers
- Enterprise (Commercial Offices and Campuses)
- Telecommunication Service Providers
- Government and Defense
- Other End-Users
- By Management Type
- Smart / Web-Managed Switches
- Unmanaged Switches
- Fully Managed Switches
- By Geography
- North America
- United States
- Canada
- Mexico
- South America
- Brazil
- Argentina
- Rest of South America
- Europe
- Germany
- United Kingdom
- France
- Italy
- Spain
- Russia
- Rest of Europe
- Asia-Pacific
- China
- Japan
- India
- South Korea
- Australia and New Zealand
- Rest of Asia-Pacific
- Middle East
- Saudi Arabia
- United Arab Emirates
- Turkey
- Rest of Middle East
- Africa
- South Africa
- Nigeria
- Rest of Africa
- North America
Geography Analysis
North America maintained 35.18% of global revenue in 2025 as hyperscale budgets funneled billions into high-speed fabric rollouts. Meta's Prometheus deployment, consuming 1 GW and stitched together by 800 GbE Spectrum-X switches, illustrates the region's technical edge. Canada is emerging as a secondary hub, given Montreal's hydro-powered cost advantages and ample land near Toronto. Enterprise refresh momentum stays steady as organizations migrate to WiFi 7 and explore zero-touch campus architectures. Regulatory scrutiny remains lighter than in Europe, yet forthcoming U.S. Department of Energy guidelines on equipment power draw could shift demand toward lower-wattage silicon over the long term.
Asia-Pacific is the fastest-rising territory, tracking 10.12% CAGR through 2031. Saudi Arabia's USD 100 billion AI capacity drive includes a 1 GW data-center partnership between STC and Humain, launched in December 2025. The United Arab Emirates tops even that with a 5 GW campus backed by Microsoft that will install tens of thousands of 400 and 800 GbE ports. India's tier-2 cities witnessed a burst of edge-facility announcements in 2025 from Yotta Infrastructure, CtrlS, and Airtel Nxtra to serve regional e-commerce and government workloads. China's Huawei and H3C dominate domestic bids, though export controls stunt global reach. Japan and South Korea anchor automotive and semiconductor manufacturing use cases, increasingly adopting time-sensitive networking. Australia and New Zealand favor subscription-managed switches to connect hybrid offices across vast geographies.
Europe confronts tighter energy rules that nudge operators toward 100 GbE rather than 400 GbE for certain workloads. The EU's Code of Conduct for Data Centers recommends power-usage effectiveness below 1.3, which directly influences switch-selection criteria. Germany is deploying IEEE 802.1DG in automotive lines, while the United Kingdom targets manufacturing robotics latency requirements. Eastern European infrastructure spending remains subdued amid macroeconomic pressures, and Russia's sanctions-constrained market relies on older architectures. South America reports incremental gains led by Brazilian 5G backhaul projects, whereas Africa is at a nascent stage with Nigeria and South Africa piloting micro-facilities around fintech hubs.
- Cisco Systems, Inc.
- Huawei Technologies Co., Ltd.
- Arista Networks, Inc.
- Hewlett Packard Enterprise Company
- Dell Technologies Inc.
- Extreme Networks, Inc.
- NETGEAR, Inc.
- Edgecore Networks Corporation
- D-Link Corporation
- TP-Link Corporation Limited
- Fortinet, Inc.
- Allied Telesis Holdings K.K.
- Alcatel-Lucent Enterprise (ALE International SAS)
- MikroTikls SIA
- Lenovo Group Limited
- NVIDIA Corporation
- Microchip Technology Inc.
- WAGO
- Edgecore Networks
- Ruijie Networks
Additional Benefits:
- The market estimate (ME) sheet in Excel format
- 3 months of analyst support
TABLE OF CONTENTS
1 INTRODUCTION
- 1.1 Study Assumptions and Market Definition
- 1.2 Scope of the Study
2 RESEARCH METHODOLOGY
3 EXECUTIVE SUMMARY
4 MARKET LANDSCAPE
- 4.1 Market Overview
- 4.2 Market Drivers
- 4.2.1 Proliferation of Cloud Data Centers
- 4.2.2 Rising Adoption of PoE and IoT-Enabled Devices
- 4.2.3 Increasing Bandwidth Demand From AI Workloads
- 4.2.4 Transition to Time-Sensitive Networking in Industry 4.0
- 4.2.5 Open Ethernet Disaggregation in Hyperscale Networks
- 4.2.6 Growth of Edge Data Centers in Tier-2 Cities
- 4.3 Market Restraints
- 4.3.1 Semiconductor Supply Chain Disruptions
- 4.3.2 High CapEx for 400G and 800G Upgrades
- 4.3.3 Alternative Fabrics (NVLink, CXL) Curtailing Port Growth
- 4.3.4 Energy-Efficiency Regulations Elevating TCO
- 4.4 Industry Value Chain Analysis
- 4.5 Regulatory Landscape
- 4.6 Technological Outlook
- 4.7 Impact of Macroeconomic Factors on the Market
- 4.8 Porter's Five Forces Analysis
- 4.8.1 Threat of New Entrants
- 4.8.2 Bargaining Power of Suppliers
- 4.8.3 Bargaining Power of Buyers
- 4.8.4 Threat of Substitutes
- 4.8.5 Competitive Rivalry
5 MARKET SIZE AND GROWTH FORECASTS (VALUE)
- 5.1 By Switch Type
- 5.1.1 Fixed Configuration Switches
- 5.1.2 Modular Switches
- 5.2 By Port Speed
- 5.2.1 1 GbE and Below
- 5.2.2 2.5/5 GbE Multi-Gig
- 5.2.3 10 GbE
- 5.2.4 25/40 GbE
- 5.2.5 100 GbE
- 5.2.6 400 GbE and Above
- 5.3 By End-User
- 5.3.1 Cloud and Data Center Providers
- 5.3.2 Enterprise (Commercial Offices and Campuses)
- 5.3.3 Telecommunication Service Providers
- 5.3.4 Government and Defense
- 5.3.5 Other End-Users
- 5.4 By Management Type
- 5.4.1 Smart / Web-Managed Switches
- 5.4.2 Unmanaged Switches
- 5.4.3 Fully Managed Switches
- 5.5 By Geography
- 5.5.1 North America
- 5.5.1.1 United States
- 5.5.1.2 Canada
- 5.5.1.3 Mexico
- 5.5.2 South America
- 5.5.2.1 Brazil
- 5.5.2.2 Argentina
- 5.5.2.3 Rest of South America
- 5.5.3 Europe
- 5.5.3.1 Germany
- 5.5.3.2 United Kingdom
- 5.5.3.3 France
- 5.5.3.4 Italy
- 5.5.3.5 Spain
- 5.5.3.6 Russia
- 5.5.3.7 Rest of Europe
- 5.5.4 Asia-Pacific
- 5.5.4.1 China
- 5.5.4.2 Japan
- 5.5.4.3 India
- 5.5.4.4 South Korea
- 5.5.4.5 Australia and New Zealand
- 5.5.4.6 Rest of Asia-Pacific
- 5.5.5 Middle East
- 5.5.5.1 Saudi Arabia
- 5.5.5.2 United Arab Emirates
- 5.5.5.3 Turkey
- 5.5.5.4 Rest of Middle East
- 5.5.6 Africa
- 5.5.6.1 South Africa
- 5.5.6.2 Nigeria
- 5.5.6.3 Rest of Africa
- 5.5.1 North America
6 COMPETITIVE LANDSCAPE
- 6.1 Market Concentration
- 6.2 Strategic Moves
- 6.3 Market Share Analysis
- 6.4 Company Profiles (includes Global Level Overview, Market Level Overview, Core Segments, Financials as available, Strategic Information, Market Rank/Share, Products and Services, Recent Developments)
- 6.4.1 Cisco Systems, Inc.
- 6.4.2 Huawei Technologies Co., Ltd.
- 6.4.3 Arista Networks, Inc.
- 6.4.4 Hewlett Packard Enterprise Company
- 6.4.5 Dell Technologies Inc.
- 6.4.6 Extreme Networks, Inc.
- 6.4.7 NETGEAR, Inc.
- 6.4.8 Edgecore Networks Corporation
- 6.4.9 D-Link Corporation
- 6.4.10 TP-Link Corporation Limited
- 6.4.11 Fortinet, Inc.
- 6.4.12 Allied Telesis Holdings K.K.
- 6.4.13 Alcatel-Lucent Enterprise (ALE International SAS)
- 6.4.14 MikroTikls SIA
- 6.4.15 Lenovo Group Limited
- 6.4.16 NVIDIA Corporation
- 6.4.17 Microchip Technology Inc.
- 6.4.18 WAGO
- 6.4.19 Edgecore Networks
- 6.4.20 Ruijie Networks
7 MARKET OPPORTUNITIES AND FUTURE OUTLOOK
- 7.1 White-Space and Unmet-Need Assessment

